Variant menu: Calculations >
 Simulation
After setting the parameters of the solar system, you can now simulate its operational state over the period of a year. A detailed description of the simulation calculations can be found in chapter Calculation Basics.
The simulation is carried out for the project’s active variant.
Proceed as follows:
-
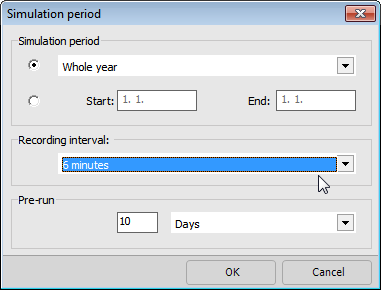
Open the Calculations > Simulation variant menu to select the simulation period and the recording interval. Different recording intervals are available depending on the chosen simulation period.
The recording interval default value of 1 hour is sufficient for most evaluations. For a more detailed analysis, select a recording interval of 6 minutes. ! By default, the simulation is run for one year from 1/1 to 12/31. You can select a month or any other period less than a year, but the simulation over an entire year is required for a final Financial Analysis.
-
Select a recording interval for which the values are to be averaged (temperatures) or summed up (energies). Shorter recording intervals prolong the duration of the simulation.
-
Select a pre-run time. The pre-run causes the temperatures in the simulation model to even out to one operating state. A pre-run of 3 days means that the simulation starts 3 days before the first recording (for a 1-year simulation: January 1). A default pre-run of 3 days is included in a simulation, but other periods can also be set. If you set an entire season as pre-run time, for example, to simulate seasonal effects on very large tanks, select a pre-run of 1 year. The simulation results during the pre-run time are not included in the results file.
-
Start the simulation by clicking OK.
-
If you start the simulation via the
 button, it will be immediately calculated with the currently preset values.
 -
Click on the Visualization
 symbol to observe the temperature profiles in the system.
The duration of the simulation interval varies between one and six minutes depending on the inertia of the system resulting from the capacity and energy supply. Set your desired simulation interval and, if you wish, switch to a view in single steps. The respective time is displayed in the footer bar of the window.
Click on the symbol again to close the visualization.
 -
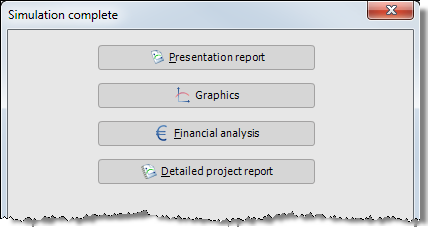
At the end of the simulation, a selection dialog for project reports, graphical evaluation, and the financial analysis opens.
-
However, you can also exit the dialog by clicking Close and continue to work via the menus or symbols.


