 Comparison Calculation
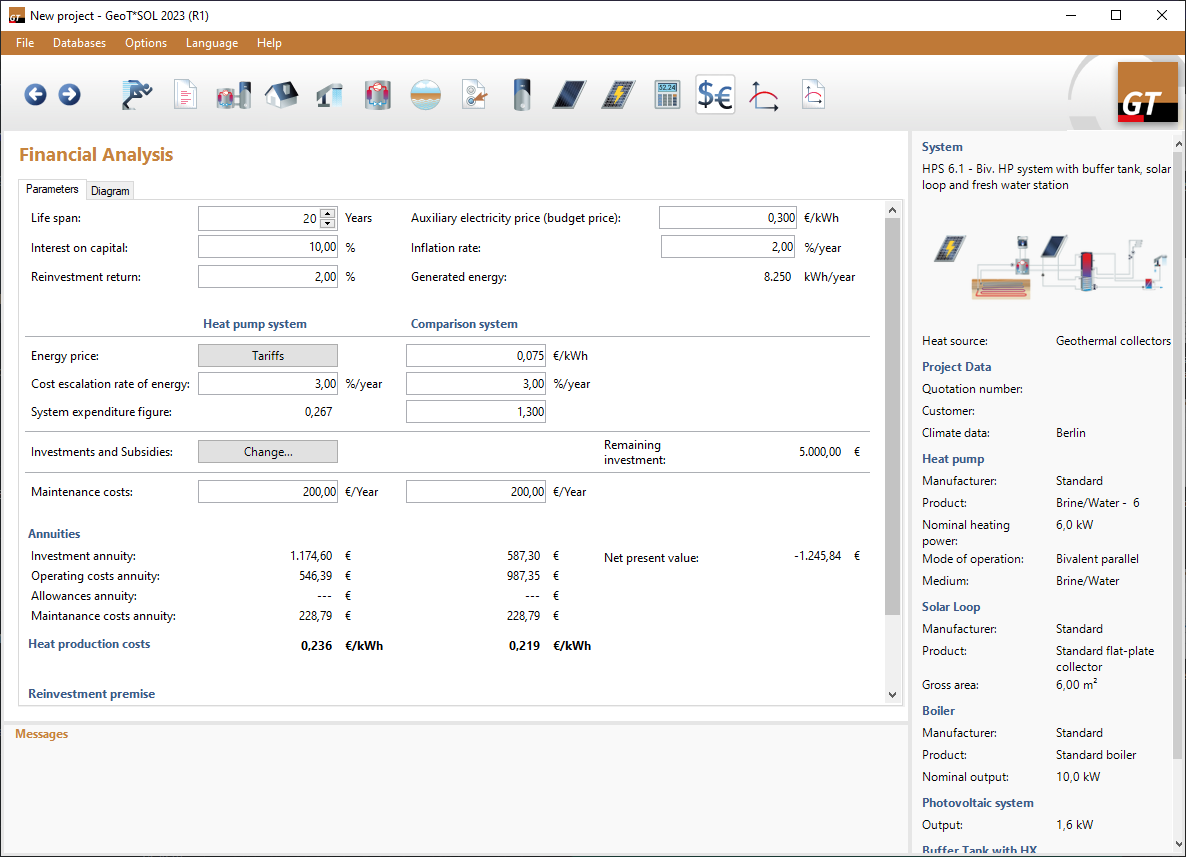
This page calculates the cost comparison and the CO₂ balance of your heat pump system compared to a conventional heating system (reference system, e.g. gas or oil boiler). The calculation is based on the total generator energy from the Simulation results. If a photovoltaic system is present, the scenario heat pump system + photovoltaics is calculated as well.
With the profiles at the top of the page, you can save and load complete sets of values:
-
Profile
(Selecting a profile loads all of its values. If your current entries differ from all saved profiles, you are asked for confirmation first.) -
Save values in profile
(Overwrites the selected profile after confirmation. Only active if the entries have changed.) -
Create new profile
(Saves the current values under a new name. Existing profiles are never overwritten.) -
Delete profile
-
Default
(The default profile is applied to new projects. The profiles Gas (default) and Oil are supplied.) -
Your own profiles for other fuels as well as for different systems, capacities or products
A profile contains the following values:
-
Service life, price increase (operating costs) and electricity price (household tariff)
-
Tariffs, base price, energy or boiler fuel price, price increase and operating costs of the systems
-
COP/efficiency and fuel type of the reference system
-
Acquisition costs and CO₂ emission factors
Enter the following parameters:
-
Service life of the heat pump system
(whole years from 1 to 50; 20 years are assumed for heat pump systems) -
expected average annual price increase (operating costs)
(applies equally to both systems) -
Electricity price (household tariff)
(for all electricity consumers outside the heat pump tariff, e.g. solar and source pump)
For the financing, enter values for the heat pump system and a reference system:
-
Base price per month
(base price of the energy contract, independent of consumption) -
With peak/off-peak tariff
(billing of the heat pump via peak and off-peak tariff) -
Fuel type of the reference system
(free text, e.g. natural gas. Used for labelling only and has no influence on the calculation.) -
Energy price (tariff)
-
Boiler fuel
(Only for bivalent systems: price of the fuel for the boiler of the heat pump system.) -
Price increase
(separately for heat pump electricity and the fuel of the reference system) -
COP/efficiency
(System efficiency of the entire system, not only of the generator alone. For the heat pump system it is calculated from the simulation; for the reference system, enter an efficiency above 0 % up to 100 %.) -
Operating costs/year
(excluding energy, e.g. maintenance, chimney sweep, repairs)
Under Acquisition costs & Subsidy, enter values for the heat pump system, if applicable heat pump system + photovoltaics, and the reference system:
-
Acquisition costs
-
Subsidy
(For locations in Germany, Calculate subsidy… provides an approximate BEG subsidy, see the page BEG Subsidy.) -
Total (chart starting value)
(Acquisition costs minus subsidy. For heat pump system + photovoltaics, the share of which heat pump system is shown in addition.)
The chart shows the cumulative costs over the service life. Each curve starts in year 0 at the acquisition costs minus subsidy and rises annually by the consumption and operating costs including price increase. The reference system is shown as a red dashed line, the heat pump system in blue and heat pump system + photovoltaics in green. The point with a vertical guide line marks the cost crossover point.
The curves rise with different slopes because the systems need different amounts of energy for the same amount of heat. A heat pump with a COP of 4 produces 4 kWh of heat from 1 kWh of electricity, while a boiler with 70 % efficiency produces only 0.7 kWh from 1 kWh of fuel. Even with a higher price per kWh of electricity, the energy costs of the heat pump are therefore lower. With photovoltaics, the electricity drawn from the grid decreases further, but the curve starts higher.
Based on this data and the information on the heat pump and the auxiliary energy consumers, the following calculations are performed:
-
Heat generation costs (service life)
Cumulative costs at the end of the service life (end point of the curve in the chart), divided by the heat generated in this period. This allows the heat pump to be compared with the reference system. Invalid values are displayed as “-”. -
Cost crossover point
Point in time (in years) from which the cumulative costs of the heat pump system are lower than those of the reference system. If it is cheaper from the start, the cost crossover point is 0; if the curves do not intersect within the service life, “-” is displayed.
Feed-in tariffs as well as a capital interest rate or reinvestment interest rate are not taken into account; all amounts are included nominally and without interest.