Lead acid batteries
There are already a large number of very good models for lead-acid accumulators in literature, which vary depending on the application. The problem with these models, which are usually based on electrical equivalent circuit diagrams (ESB), is the parameterization for any battery types. Since the intersection of existing models and the requirements analysis was too small for our simulation model, a separate model was developed that combines parts of the ESB with empirical elements.
The main requirements that our model meets are the following:
- The voltages are precisely mapped (difference discharge and charge, internal resistance, crystallization)
- The characteristics of the discharging and charging processes are as realistic as possible
- Self-discharge is taken into account
- The normative cycle load and service life are included in the simulation
In order to map the characteristics of a specific battery, the model requires the following parameters from the data sheet:
- Capacity as a function of discharging time
- Internal resistance
- Type of construction (sealed, closed, gel, etc.)
- Maximum depth of discharge (usually 80 %) and maximum discharge current
- Self-discharge rate
- Number of cycles above discharge depth
Discharging
The calculation of the characteristic diagram is essential for discharging. Lead-acid batteries show a characteristic with continuously decreasing voltage when discharged with constant current. The higher the discharge current, the greater the voltage drop. Figure 1 shows the modeled discharge profile for a 600 Ah cell loaded with varying power.
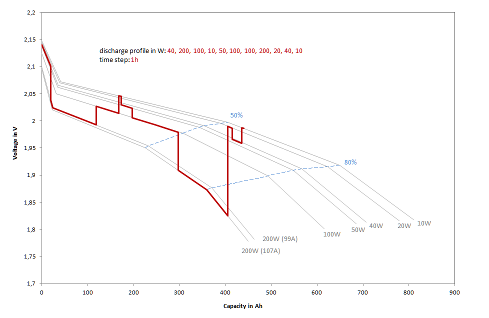
Figure 1: Typical discharge profiles (W) (voltage over capacity) for a 600 Ah cell with time step = 1 hour
For the simulation, the characteristic curve of voltages and capacitances must first be calculated for each discharge current. The design of the battery, its internal resistance and capacity characteristics play a decisive role. If discharge is to take place at constant power, the discharge current must be iteratively approximated in order to obtain the desired power during the time step via the integral of the voltage change and the current. The discharge cut-off voltage given by the maximum discharge depth must also be observed. To protect the batteries, they must not be discharged by more than 80% as a rule. Since the total capacity of the battery changes with the discharge current, the final discharge voltage also depends on the current, as shown in Figure 1.
The state of function ensures that before discharging a certain amount of energy it is checked whether, after discharging, the resulting current falls below the maximum discharge depth and rejects the discharge if necessary.
Charging
A battery can be charged according to different charging profiles, in which case an CV0V profile is used.
First, a constant current is charged (C-charge or bulk phase), while the voltage in the cell increases. Once a defined voltage is reached, a time-controlled phase with constant voltage takes place, whereby time duration and charging voltage can vary.
- Boost charge (V0): 2 h from 2,4 to 2,45 V
- Full charge: 5 h at 2,4 V
- Float charging: 10 h at 2,4 V
Subsequently, i.e. after the specified period of time, the voltage is reduced to 2.23…2.3V during the float charging phase in order to avoid overcharging. How high the so-called charge retention voltage must be, is taken from the data sheet of the battery.
During the bulk phase, constant current is usually charged until the cell voltage reaches the preset value. Unfortunately, there is no formal connection between charging current, SOC and the voltage in the bulk phase in the literature.
Therefore, the charging diagrams shown in various sources were evaluated and a formula for determining the charging voltage as a function of the current (xC as C rate) and the SOC was developed.
$$ U_B (SOC, xC) = U_R (SOC) + U_K + SOC^2 (0.35 + 0.15 xC) $$
- $V_B$ - Bulk voltage
- $V_R$ - Idle voltage
- $V_K$ - Voltage drop due to crystallization
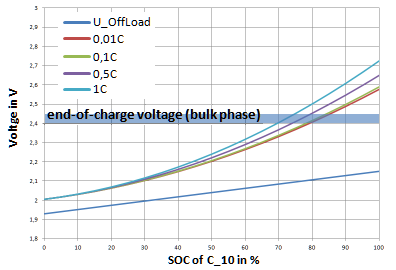
Figure 2: Dependence of cell voltage on charging current and SOC10 for different charging currents
The higher the discharge current, the sooner the voltage limit is reached for the next phase - but the lower the SOC at this voltage. The Ah efficiency of a cell during operation can also be calculated from the different voltage levels between charging and discharging.
Cycles, Durability
The data sheets show the number of cycles of discharging and charging processes measured according to standard (DIN EN 60896), after which the C3 capacity that can still be withdrawn up to a final charging voltage of 1.7 V still amounts to 80 % of the rated capacity (according to standard also C3).
According to the standard for closed cells, 2 hours of discharge are performed in cycles with currents of 2 C10, which corresponds to a discharge depth of DOD = 40 % relative to C10. With closed cells it is 3h with 2 C10, which is why a discharge depth of DOD = 60 % is achieved here.
The diagram “Number of cycles over discharge depth”, which can be found on many data sheets (see below from data sheets of three different manufacturers), extrapolates this one pair of values, measured according to the standard, always approximately according to the relationship “half discharge depth - double number of cycles”. This ideal connection is shown with dashed lines.
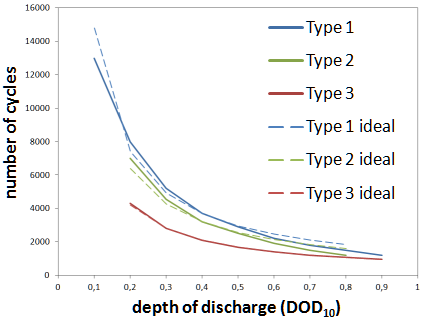
Figure 3: Relationship between discharge depth and number of cycles of different batteries
In practice, however, a deeper cyclization usually has a greater effect on the capacity loss than a flat one, which is why the curves given deviate from the ideal shape. This can be taken into account with correction factors that vary depending on the battery series and manufacturer.
During the entire simulation (only in case of discharge) an ampere-hour balance is formed, whereby at each time step the currently withdrawn capacity, weighted with the correction factors for the cycle load $f_\text{Ah}$ from the above graphic, is added.
This Ah-balance can be compared with the total number of cycles measured according to the standard and is then included in the calculation of the capacity decrease, so that after reaching the total number of cycles the nominal capacity has dropped to 80%:
$$ C_{\text{N}} (C_{\text{Ah}}) = C_{\text{N,0}} (1- 0.2 \zeta ) $$
with the cycle load
$$ \zeta = \frac{\sum ^{\text{now}}_{i=0} \left( f_{\text{Ah,i}}(DOD_{10}) I_i t_i \right) }{C_{\text{Ah,N}}} $$
- $C_{\text{N}}$ : Nominal capacity
- $C_{\text{N,0}}$ : Nominal capacity at the start of use
- $C_{\text{Ah}}$ : Balanced Ah capacity
- $C_{\text{Ah,N}}$ : Balanced Ah capacity of the standard cycles
If it is assumed that a battery whose capacity has fallen to 80% of its initial value during use can no longer perform the functions for which it was intended, it must be replaced when a cycle load of 1 is reached.
Since the cycle load is still counted as a system variable after a battery has been replaced, a second, battery-related value is introduced, the State of Health, SOH:
$$ SOH = 1 - \Delta \zeta_x $$
- $\Delta \zeta_x$ : Change in cycle load since last replacement
A battery with $SOH=1$ is new, a battery with $SOH=0$ is replaced. The service life is the result of the cycle load achieved after the simulation of one year:
$$ t_{\text{ Leben }} = \frac{t_{\text{ Simulation }}}{\zeta} $$
- $t_{\text{ life }}$: Life cycle
- $t_{\text{ simulation }}$: Simulation period
- $\zeta$: Cycle load
See also