Li-Ion batteries
Lithium batteries differ from lead-acid batteries in their behavior and are simulated with a distinct model. The focus is on mapping the typical voltage behavior of the most important active materials for lithium batteries in battery storage systems.
How the simulation model works
The problem of parameterization for any type of lithium battery is similar to lead-acid batteries. In addition, there is the problem of active material-dependent voltage levels. These vary between 1.5…4.25 volts for lithium batteries. Figure 1 shows a series of voltage levels.

Figure 1: Voltage levels and curves of lithium cells of different active materials in the event of discharge
The simulation model for lithium batteries was developed using discharge curve diagrams from manufacturer data sheets in which the voltage over capacity is plotted for different discharge currents. In this way, the active material and cell-dependent voltage can be taken into account. As an example, Figure 2 shows the typical discharge curves of a lithium-iron-phosphate cell.
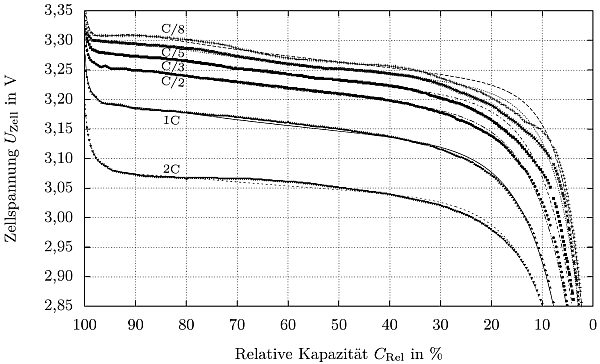
Figure 2: Current-dependent discharge curves of a lithium-iron-phosphate cell with varying discharge currents
The data points of these discharge curves are taken from the manufacturer’s data sheets. Subsequently, approximation functions are adapted to the discharge curves with the aid of curve fitting. The resulting voltages at any current are interpolated.
The functions of the model can be summarized as follows:
- The voltages are displayed cell-dependent (depending on active material and state of charge, difference discharge and charging, internal resistance)
- Self-discharge is taken into account
- The normative cycle load and service life are included in the simulation
- The Peukert exponent is taken into account according to the discharge curves
Discharging
The stored characteristic map is used for discharging. Lithium batteries show the characteristics shown in Figure 4 when discharged with constant current. The higher the discharge current, the greater the voltage drop. Figure 3 shows the voltage curve with varying current draw.
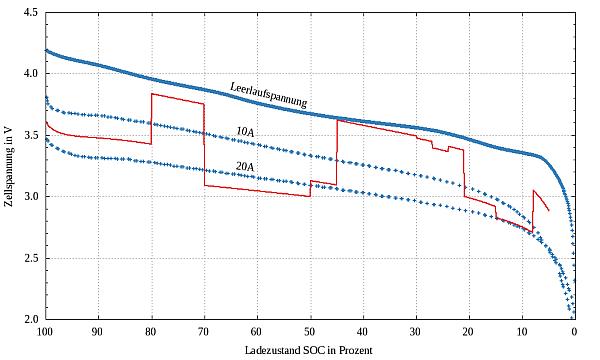
Figure 3: Voltage curve discharge case (voltage over capacity) with varying current draw
If discharge is to take place at constant power, the discharge current must be iteratively approximated in order to obtain the desired power during the time step via the integral of the voltage change and the current.
The discharge cut-off voltage given by the maximum discharge depth must also be observed. To protect the lithium batteries, they should not be completely discharged. Since the total capacity of the battery changes with the discharge current, the final discharge voltage also depends on the current, as shown in Figure 4 and Figure 5.
Charging
The battery is charged according to the settings of the Charging strategy of the battery system.
See also