Climate data
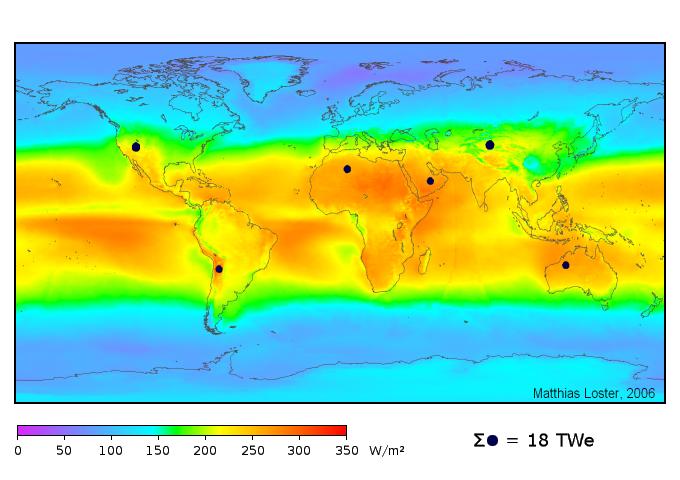
Average irradiation on the earth's surface in W/m². The theoretical area of the black points would be sufficient to cover the entire energy demand of the earth's population. Source: Wikipedia.
The climate data supplied in PV*SOL® are based on MeteoNorm from the Swiss climate and weather data experts Meteotest. In addition, MeteoSyn contains the climate data module of PV*SOL®, many climate data from the German Weather Service (DWD), which cover all of Germany.
Data from MeteoNorm
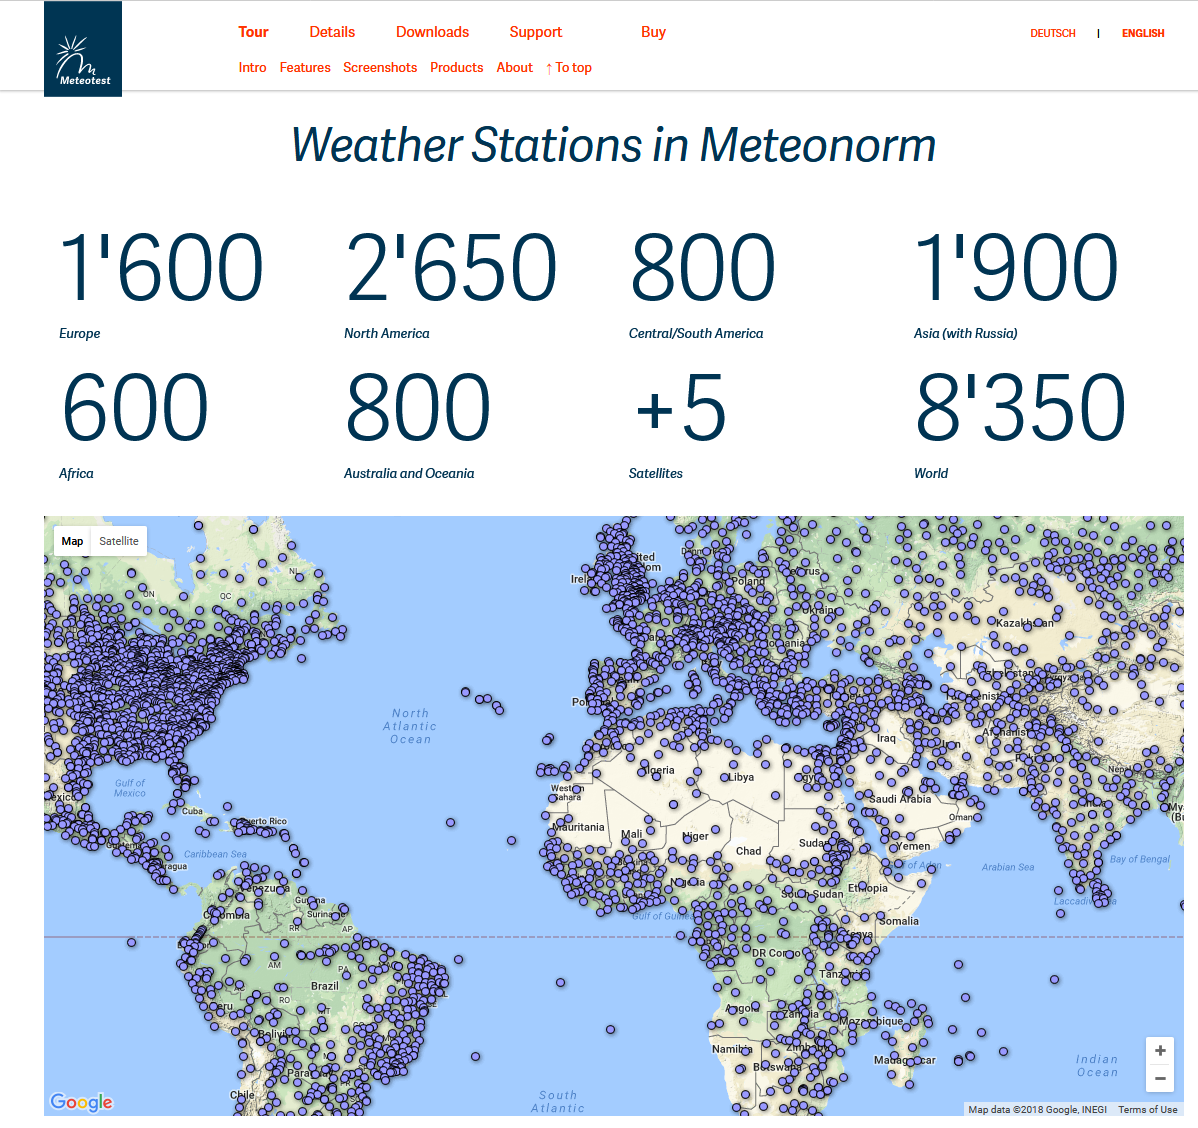
Overview of the supplied climate data locations in PV*SOL . Source: Meteotest
The climate data supplied include a total of 9492 ground measuring stations, which are divided as follows:
- 3131 locations in Europe
- 2128 locations in Central and North America
- 590 locations in South America
- 1934 locations in Asia
- 735 locations in Africa
- 682 locations in Australia and Oceania
- 41 locations in Antarctica
- 58 locations in International Waters
Locations that are not included can be interpolated using satellite data and adjacent ground stations. Therefore climate data is available for every place on earth.
Other data sources
In addition, another 436 climate data locations for Germany are supplied by the German Weather Service (DWD). These are test reference data sets from 2017, with climate data period 1995-2012. DWD
For Great Britain all 24 climate data sets of SAP 2012 are included. SAP 2012
For Italy more than 100 climate data sets of the Italian standard UNI 10349 are included. UNI 10349
For Spain another 37 climate data sets are included.
For the USA more than 1000 climate data sets according to the standard of the typical meteorological year, version 3 (TMY3) are included. TMY3 manual
What are climate data sets? What does “Typical meteorological year” mean?
The climate data sets comprise measured values in periods between 10 and 30 years, often 20 years are used. It is important to note that these data are not simply averaged, because the result would be unusable, “washed out” climate data that have nothing to do with reality.
Instead, a representative collection of days is compiled from the measurements of the last 10 or 20 years is compiled, a so-called typical meteorological year (TMY). This means that in the final data set, the hourly values of a day are not averaged over years and are not calculated according to minimum or maximum values, but instead are taken from a specific year.
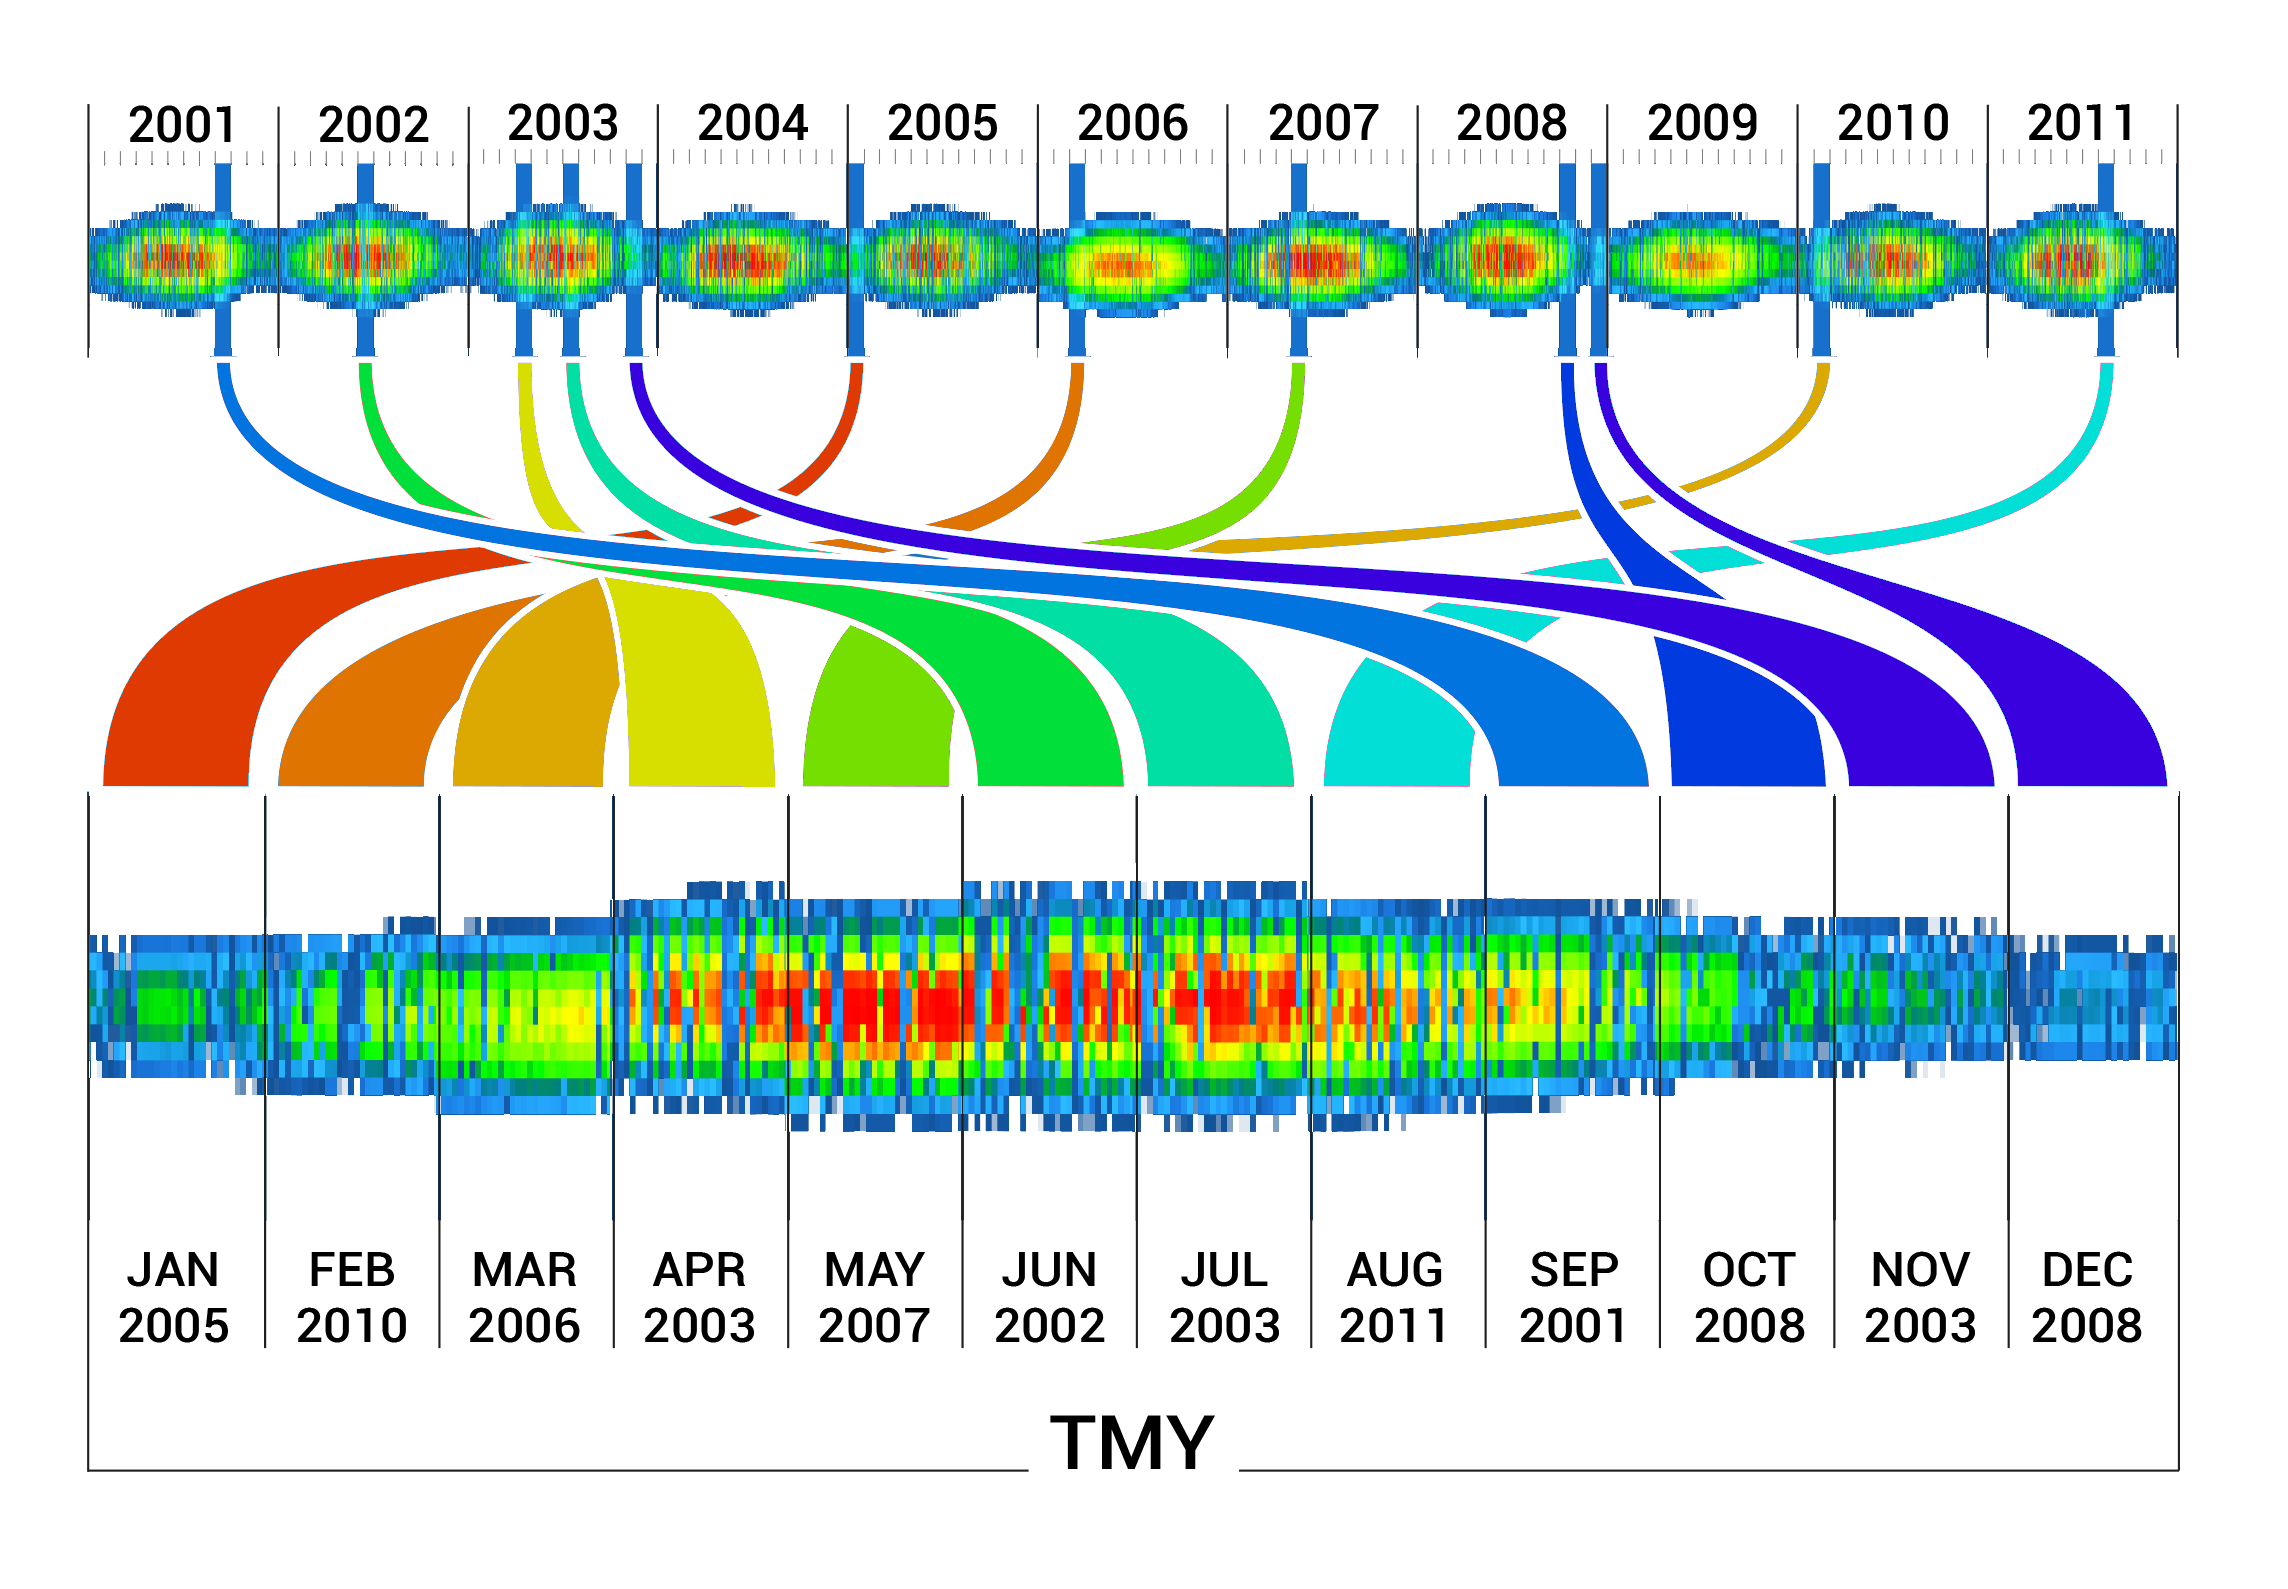
Illustration of the composition of a TMY. Source: Own representation of Valentin Software GmbH, https://creativecommons.org/licenses/by-nc-sa/4.0/
The data for the next day may come from another year. There is a lot of information about the exact compilation of TMY on the Internet. NREL’s TMY3 manual gives a good introduction to the topic: [TMY3 manual] (https://www.nrel.gov/docs/fy08osti/43156.pdf)
It should also be noted that, for example, the own consumption of PV energy at a certain point in time is strongly dependent on the specific value of solar radiation and would possibly change significantly depending on which measurement year was used. It is important to understand that TMY data does not guarantee values for a specific point in time. However, they guarantee that the data for the location is typical over the year, i.e. represent the normal meteorological conditions. And although the probability of a certain value for a certain time cannot be quantified, the overall uncertainty of the climate data can still be quantified. This presentation offers a good introduction to this topic: Accuracy of MeteoNorm
See also