Results
Go to the
![]() Results page to start the simulation.
A progress bar and a daily display show the simulation calculation.
Calculated is in each case over one year from 01.01. 00:00 a.m. until 31.12. 11:59 p.m.
Results page to start the simulation.
A progress bar and a daily display show the simulation calculation.
Calculated is in each case over one year from 01.01. 00:00 a.m. until 31.12. 11:59 p.m.
When the simulation is complete, the results of the yield simulation and profitability calculation are displayed.
Click on a
![]() result table or a
result table or a
![]() diagram in the tree directory to display the respective results in the window on the right.
diagram in the tree directory to display the respective results in the window on the right.
Overview
After completion of a simulation, an overview of the most important results is given:
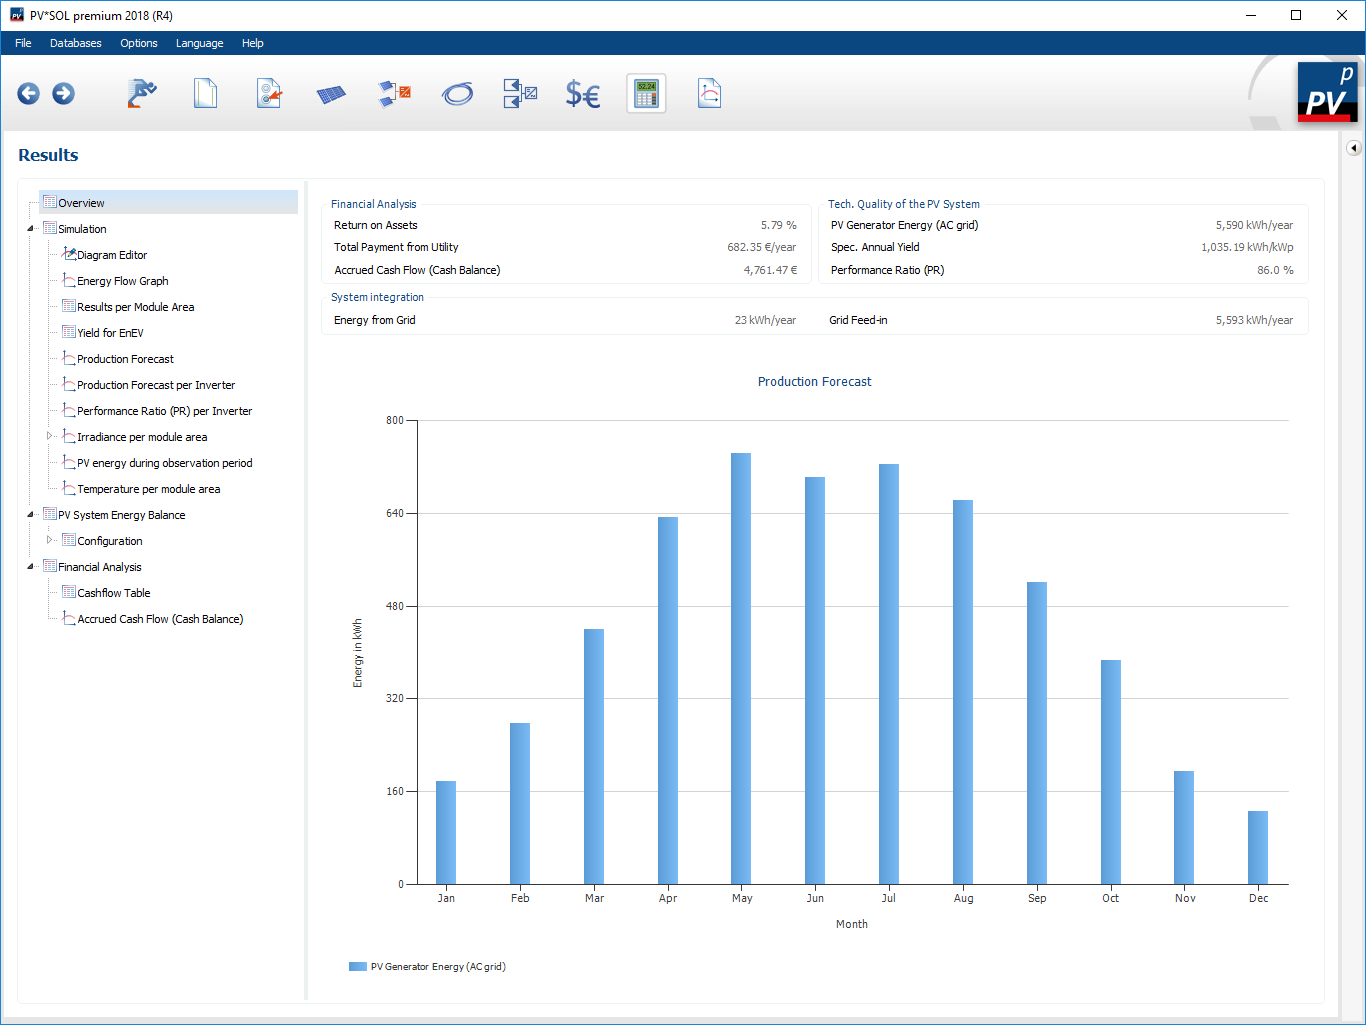
In addition to the economic efficiency and technical quality of the plant, the monthly yield forecasts are displayed as a bar chart.