Google Solar API
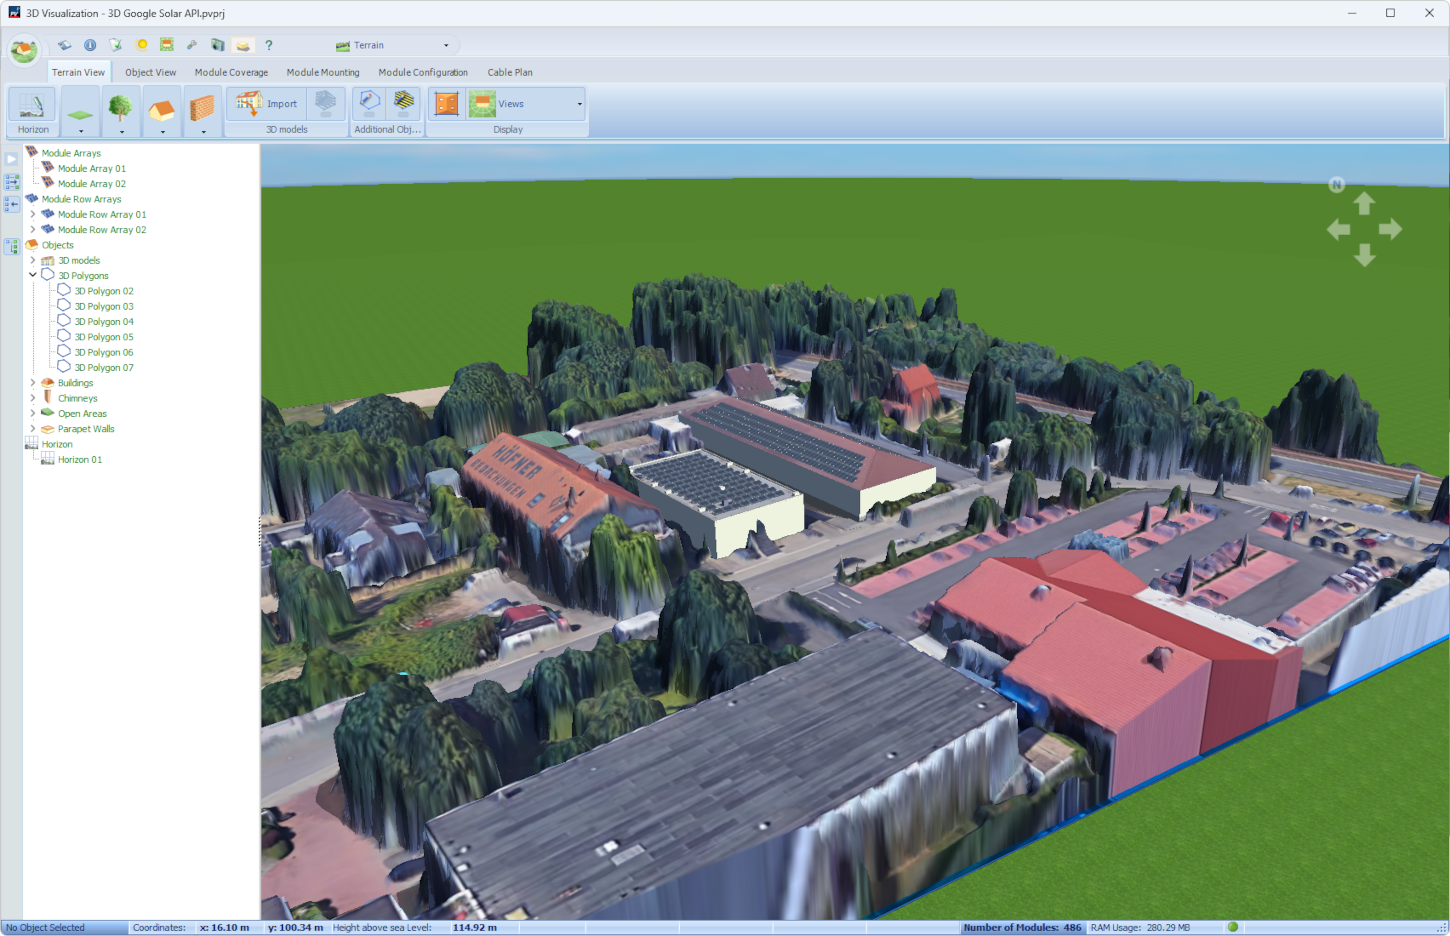
With the data from the Google Solar API, precise and good-looking 3D plans can be realized quickly and easily - shading environment included
Terms of use
By using the Google Solar API, you agree to Google’s terms of use and privacy policy. Further information can be found here https://developers.google.com/maps/documentation/solar/policies
Terms of use: https://cloud.google.com/maps-platform/terms/
Privacy policy: https://policies.google.com/privacy
Procedure at a glance
This section briefly explains the steps that make up a typical plan using Google Solar API data.
The prerequisite is a separate API key for the Google Solar API. This can be created quickly and easily, see here.
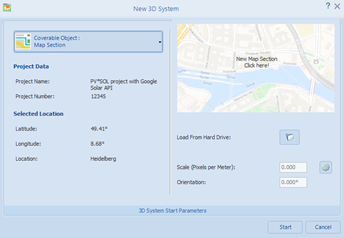
- A new 3D project is started
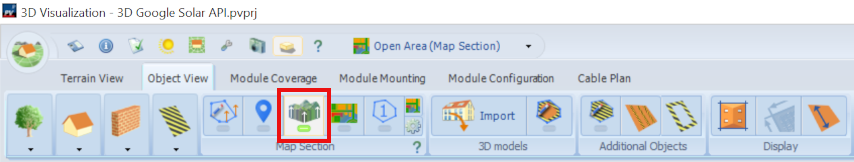
- The “Map section” mode is selected
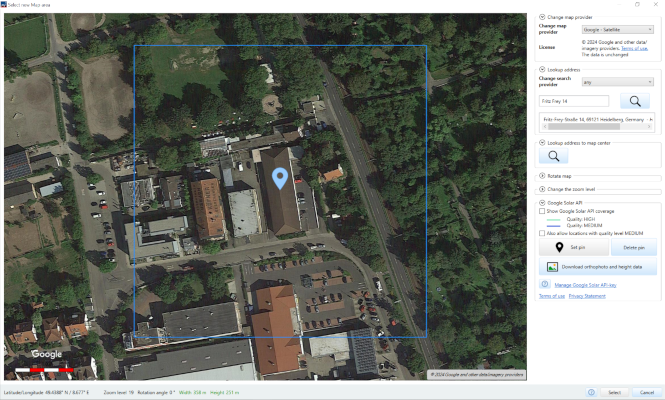
- In the map tool, a pin is placed on the building that you want to plan
- An orthophoto and the corresponding elevation data are downloaded for a 200m x 200m area around this pin
- This data can be transferred to the 3D planning

- The buildings to be covered with PV are extruded as before - with the advantage that the height values are now available for each point
- Neighboring buildings, trees or height differences in the terrain are automatically displayed by the new 3D terrain model and included in the shading calculation

- Done!
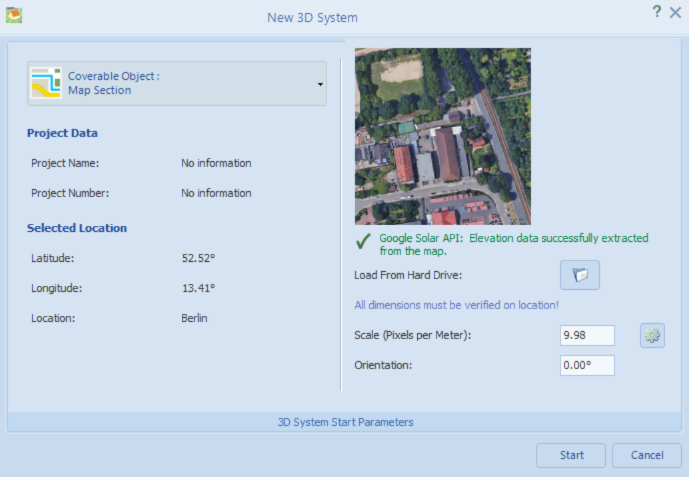
Map section
The Google Solar API section of the map section window can be structured differently depending on whether a Google Solar API key is available and which map provider has been selected. Managing the Google Solar API Key is always possible. Click the link to open the corresponding section in the options dialog.
The Google Solar API provides access to the solar potential, orthophotos and elevation data of hundreds of millions of buildings. In PV*SOL® we only use the orthophoto and the associated elevation data. Further information can be found on the official homepage, Google Solar API.
No Google Solar API key has been stored yet
A window appears in which the API key for the Google Solar API can be entered.This is saved locally and used for all further requests.Under no circumstances will this API key be disclosed to third parties or Valentin Software GmbH.If an error has occurred during entry, the API key can be managed at any time via the Program options dialog.
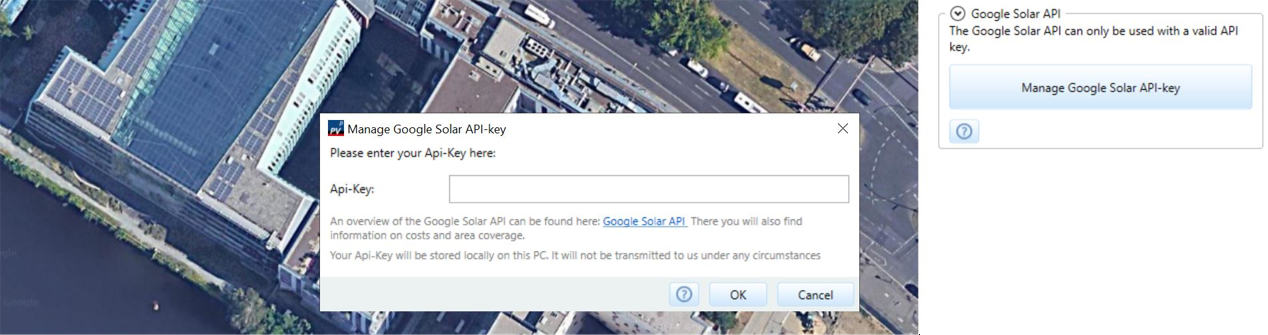
The Google Solar API key can be stored in PV*SOL
The prerequisite is a separate API key for the Google Solar API. This can be created quickly and easily, see here here.
Cost per request
Each request is charged USD 0.075 as of July 2024. Billing takes place directly with Google, Valentin Software GmbH is not involved in the payment process and will therefore not issue any invoices in this context.
At present (as of July 2024), Google only charges a monthly amount of USD 200.00 or more. This means that around 2666 requests per month can be made without billing.
Google Solar API key is stored
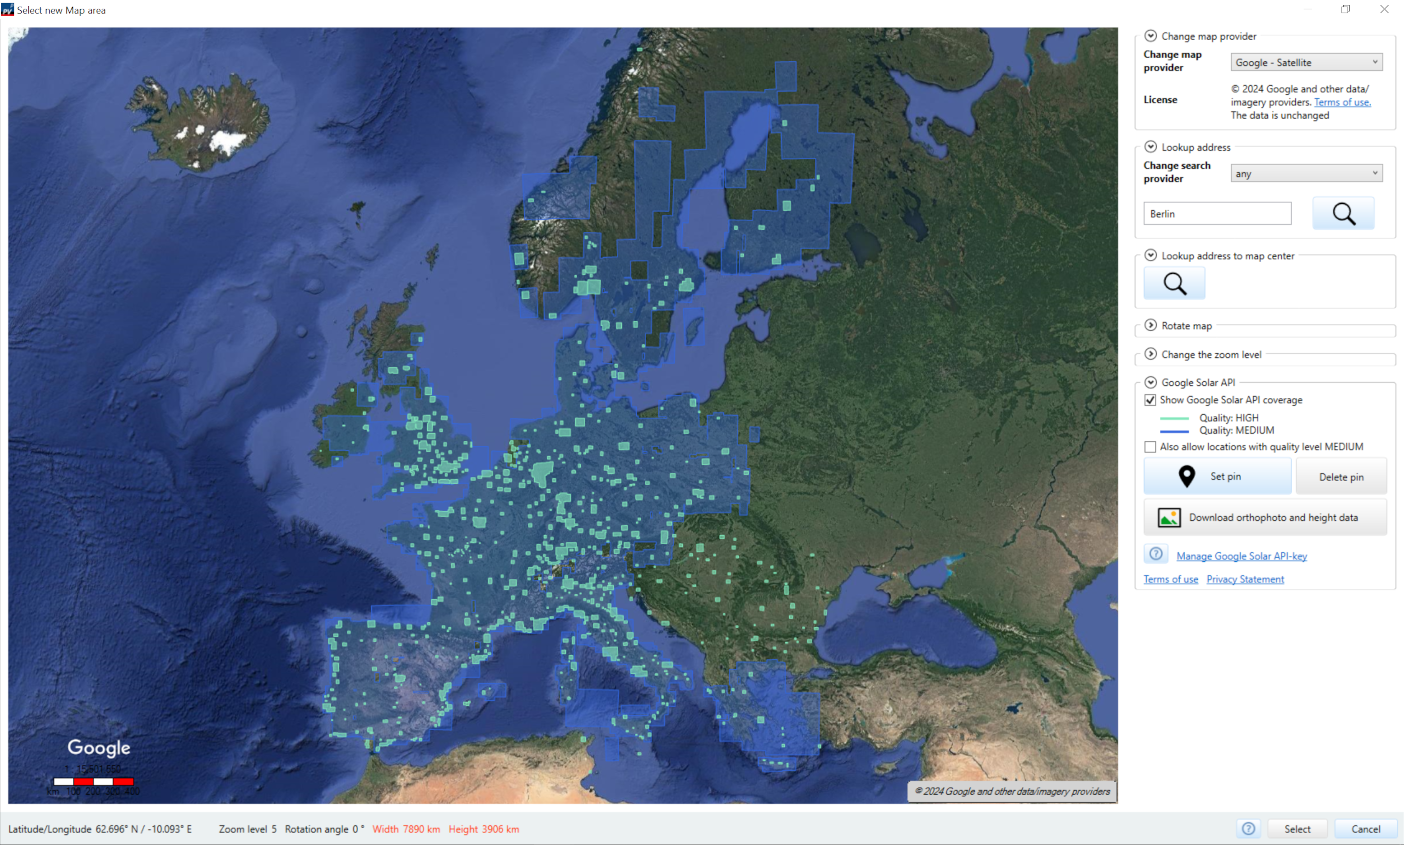
At which locations which quality level of the Google Solar API is available can be displayed with the additional coverage layer
The orthophotos and the associated elevation data from the Google Solar API are available in two quality levels:
- HIGH - High resolution and good data quality (10 cm), based on low-altitude overflights
- MEDIUM - Medium resolution (e.g. 25 cm), often based on overflights at higher altitudes or satellite data.
The medium-quality orthophotos can be roughly compared with the normal satellite images from Google Maps.
The quality of the altitude data is subject to strong fluctuations and is not suitable for precise planning in most cases.
This quality level is therefore deactivated by default.
Please note that there may be deviations in the actual availability in marginal areas between the high and medium quality areas. For example, the Rewe store in Zeuthen near Berlin is shown in the green zone, but there is no data in quality level HIGH for this location.
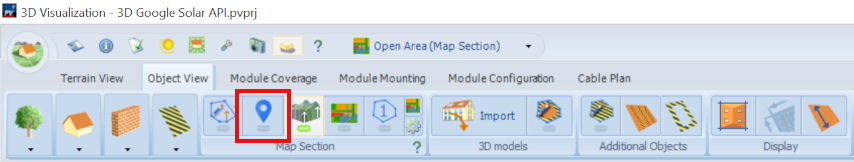
Overview of the individual functions
-
 Show GoogleSolar API coverage:
Activation of a layer of the map coverage
High-resolution data is available for locations in green areas, but only medium quality for locations in blue areas. The layer is removed when the card is changed. An overview and further details can be found in the Google Solar API online documentation -
Also allow locations with the quality level MEDIUM:
Locations where only the MEDIUM quality level is available are also taken into account. If a request is made for HIGH image material in a MEDIUM area, an error occurs. As of July 2024, there are no costs in this case. -
Button
Set Pin -
Button
Delete Pin:
If the position does not cover the desired range, the current pin can be deleted and a new pin can be set using the ‘Delete pin’ button. -
Button
Download Orthophoto and height data:
The orthophoto and the elevation data are downloaded for the selected centre point. As these files are very large, there may be a waiting time of approx. half a minute. If the download was successful, the ‘Preview’ window opens. If an error occurs, a window with an error message is displayed In this case, please contact our support team.
The steps
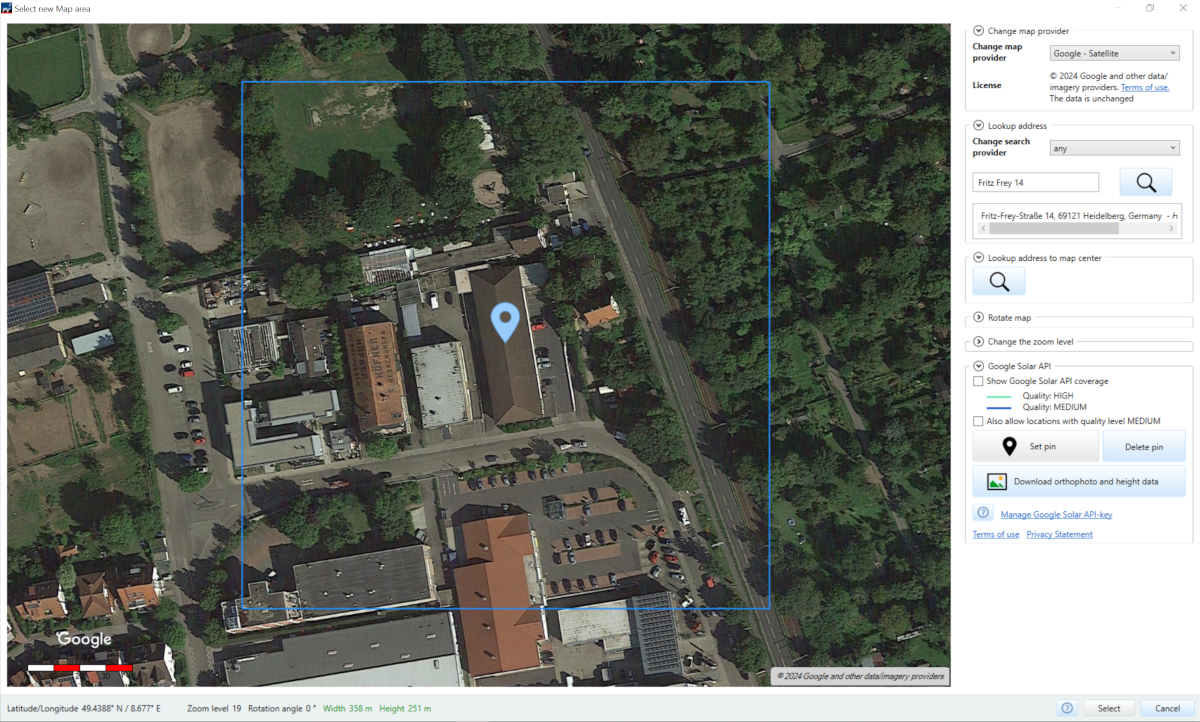
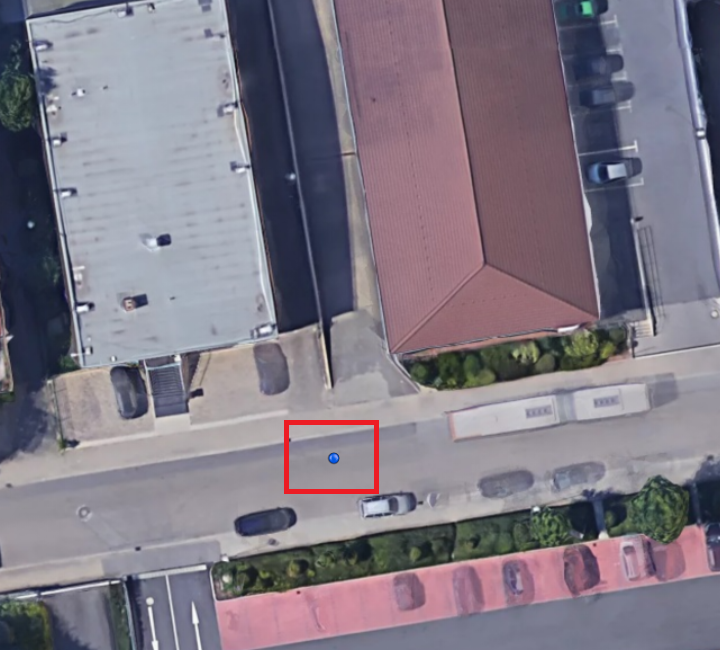
A 200m x 200m tile is downloaded around the pin. The blue frame visualizes the dimensions on the map
- Search for the target object and place it approximately in the center of the map section
- Click the ‘Set pin’ button.The system switches to ‘Set pin’ mode.In this mode, the map can no longer be moved or zoomed.The mouse buttons are now assigned as follows:
- Left mouse button: Place pin
- right mouse button: “Set pin” Exit mode
The mode can also be exited using the
ESCkey.
- Place a pin on the card.This represents the center point for the 200m x 200m orthophoto and its elevation data.To visualize the size of the rectangle, an approx. 200m x 200m blue frame and the pin drawn.
- If the position does not cover the desired area, the current pin can be deleted using the ‘Delete pin’ button and a new pin can be placed.4. Click on the button ‘Download location photo and elevation data’.
The tip of the mouse pointer is decisive for the center point!
- If the position does not cover the desired area, the current pin can be deleted using the ‘Delete pin’ button and a new pin can be placed.4. Click on the button ‘Download location photo and elevation data’.
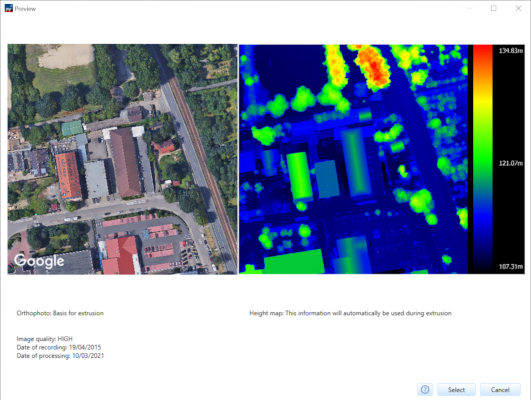
The Preview-Window

In the preview window you can see the preview images of the orthophoto and the elevation data
The images downloaded from the Google Solar API are displayed in the preview window.
The altitude data is visualized by a colour-coded image. Furthermore, the current quality level, the recording date and the date of processing by Google are displayed.Click on
 to transfer the Ortophoto and elevation data to the 3D environment.
The map does not allow the use of the Google Solar API
It is currently not possible for some card providers to use the API. Only a hint text appears.
Transfer of data from the map section
After the successful transfer, the following note is displayed under the preview of the map section
Click on “Start” to transfer to the 3D project.
Status Bar
In the status bar at the bottom of the program, in addition to the usual display of the X and Y coordinates for map sections with altitude data, the altitude is now also displayed at the mouse cursor.This is the indication of the “altitude above sea level”.Depending on the location, this value can also be negative.

Move the mouse pointer over the map section to see the corresponding altitude value
Set Pin
You can use the 'Set pin' button to set a reference for the height values
Often, however, the heights in relation to the ground should be displayed in the terrain, e.g. to determine the height of the eaves or the ridge height. The “pin” was introduced for this purpose. Set pin:
- Click on the “Pin” button (an on/off button)
- Pin mode is activated. Button lights up permanently
- A small blue circle appears in place of the mouse pointer
- Click to place it on a road or other flat surface for which the height information is to be displayed
- The height information “Height above pin” appears in the status bar and is continuously updated when the mouse is moved.
If the pin is placed on the ground surrounding the building, the height values are displayed in relation to the pin
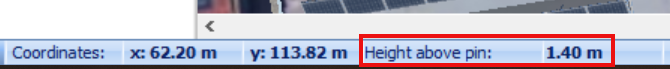
If the blue reference pin is set, the height values are displayed in relation to the blue pin
Remove pin:
- Clicking the button again deactivates the pin mode and the pin (blue circle) disappears from the map section in the editor
- Altitude information refers to “altitude above sea level” again
The pin can also be used on the roof - very helpful on flat roofs to check the height of the superstructure
Extrusion
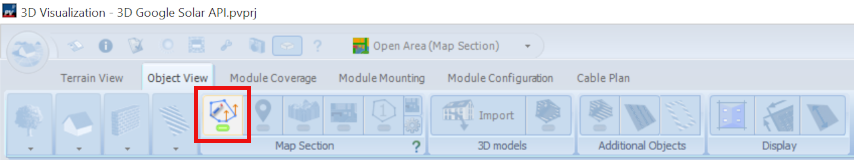
Use the 'Draw polygon' button to activate the mode for drawing polygons, which can then be extruded into buildings
Para extruir edificios, dibuje primero las superficies de los tejados con polígonos como de costumbre.
- If the pin is already activated, it is much easier to draw polygons that are to be used to extrude buildings, for example
- The current height of the point under the mouse pointer is displayed directly as a tooltip next to it
- This assistance can be used to ensure that e.g. all points of an eave are approximately at the same height, which enables more precise extrusion.
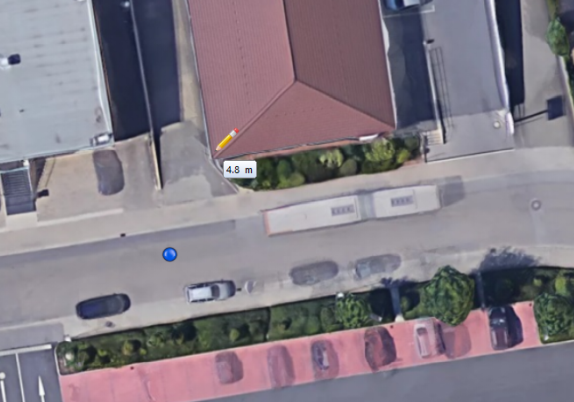
When drawing polygon points, you can now see the associated height value directly on the mouse pointer
If you are tracing a roof surface with a polygon, make sure that the points drawn are at roughly the same height for the best possible results. Minor deviations can be corrected using the extrusion algorithm.
Blue vs red pin
- As long as no manual pin (blue) is placed near the polygon to be extruded, the reference point to which the height data for the object is determined is determined automatically
- This point can be seen in the image as a red circle directly on the building. In this case, the pin symbol in the dialog remains greyed out.
Display height values of a polygon
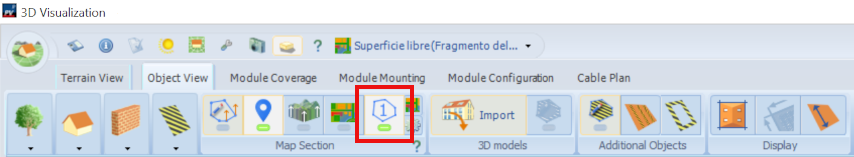
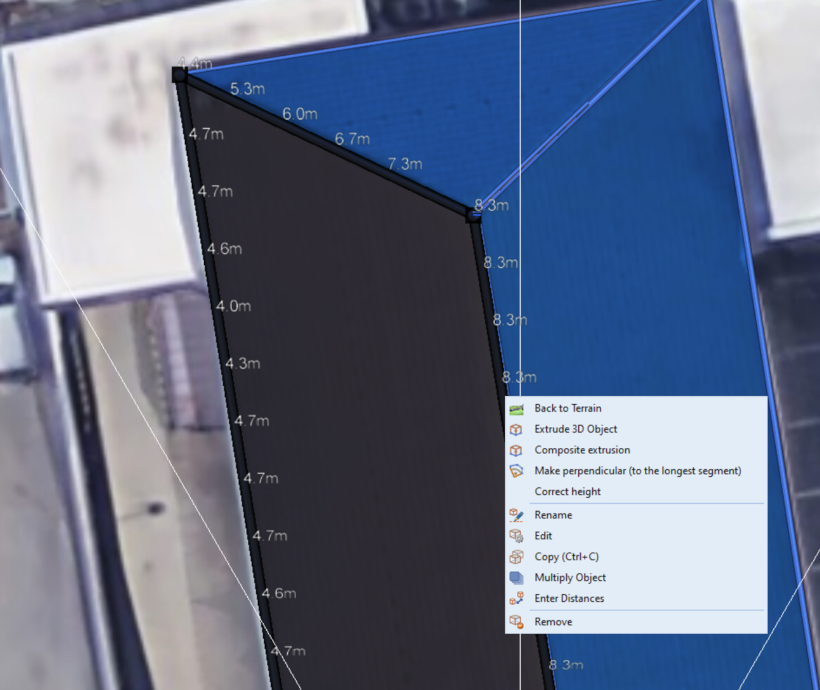
Activate the 'Show polygon heights' button and then select the polygon whose height values you would like to have displayed
- Click on the ‘Show polygon heights’ button (an on/off button)
- When the button is activated (illuminated), the height values are displayed at regular intervals on the selected polygon
- This means that corrections can be made to the polygon before it is extruded, especially after it has been “squared”
- The better the polygon segments are aligned with the true height values, the better the results when extruding
- The height values are displayed in relation to the pin if it has been set
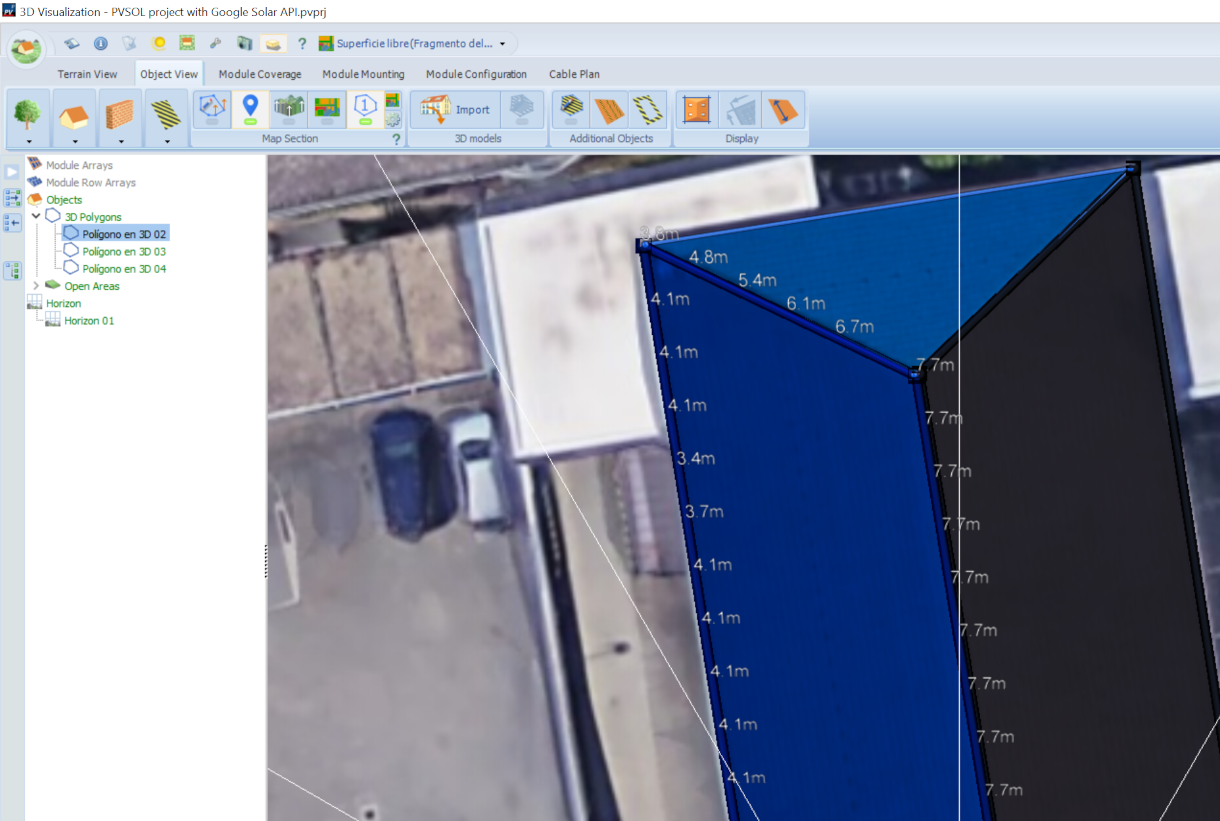
The current altitude values are displayed at regular intervals along the polygon lines
Consideration of the height values during extrusion
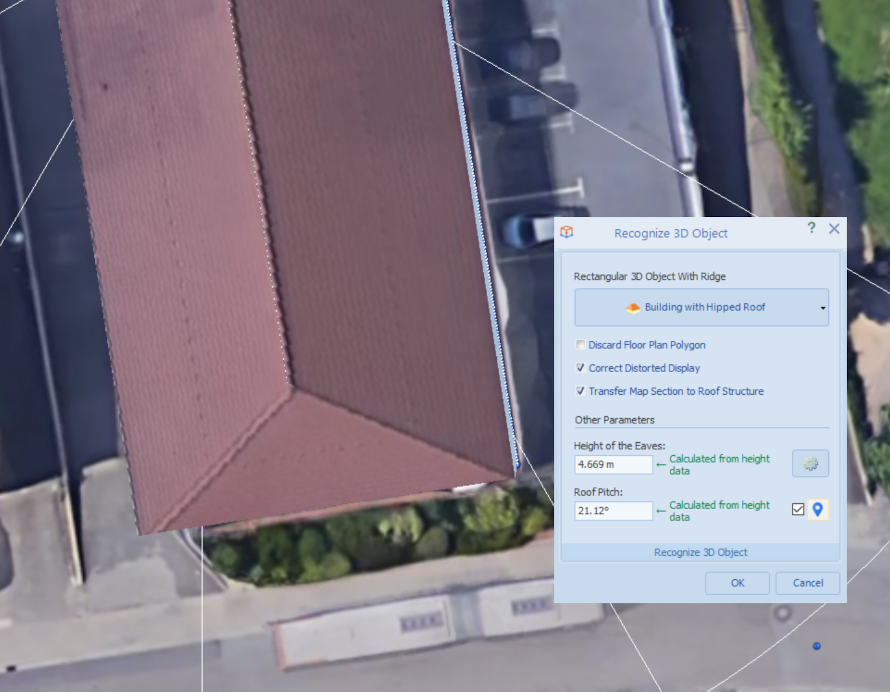
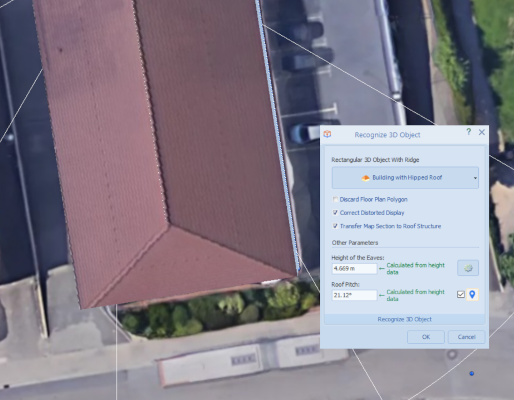
When extruding buildings (and other objects), the heights and angles are now determined automatically from the height data
- Right-click on a polygon to display the context menu.
- As before, select “Extrude 3D object” to extrude the polygon into a building.- The height values are used to automatically determine the eaves heights, ridge heights and roof pitches.- The heights of flat roofs and all other 3D objects that have a height (such as walls, trees, chimneys, etc.) are also determined. - For this purpose, an attempt is made to guess probable object types during extrusion, such as chimneys if there is a significant height or skylights if there is no significant height on the roof.
Extrude with Pin
- If a pin has been placed near the polygon, it is automatically taken into account during extrusion (pin activated). - The pin should be no further than 20 m away from the polygon in question. - If the pin checkbox is deactivated, the red pin appears again near the building floor plan. It shows the position relative to the automatically determined “base point”. If the pin is reactivated, the red background dot disappears. - If you switch back and forth between the pin and the base point, the heights of the objects may change slightly. The inclinations are not affected!- If the values are finally adopted, the origin of the data is no longer referenced in the actual dialogs of the 3D objects!
Extrude in a compound
If you have traced the roof surfaces of the building individually, you can extrude all roof surfaces at the same time 'as a composite'
With the new ‘Extrude in compound’ option, you can extrude several contiguous polygons in one go. Contiguous polygons (gap smaller than 0.5 m) are automatically recognized. Procedure:
- Draw the polygons of the individual roof areas precisely
- Ensure that the ridge segments are exactly on top of each other
- Using the height information on the mouse pointer, ensure that the eaves heights are approximately the same height
- Then right-click on one of the polygons and select “Extrude in composite”
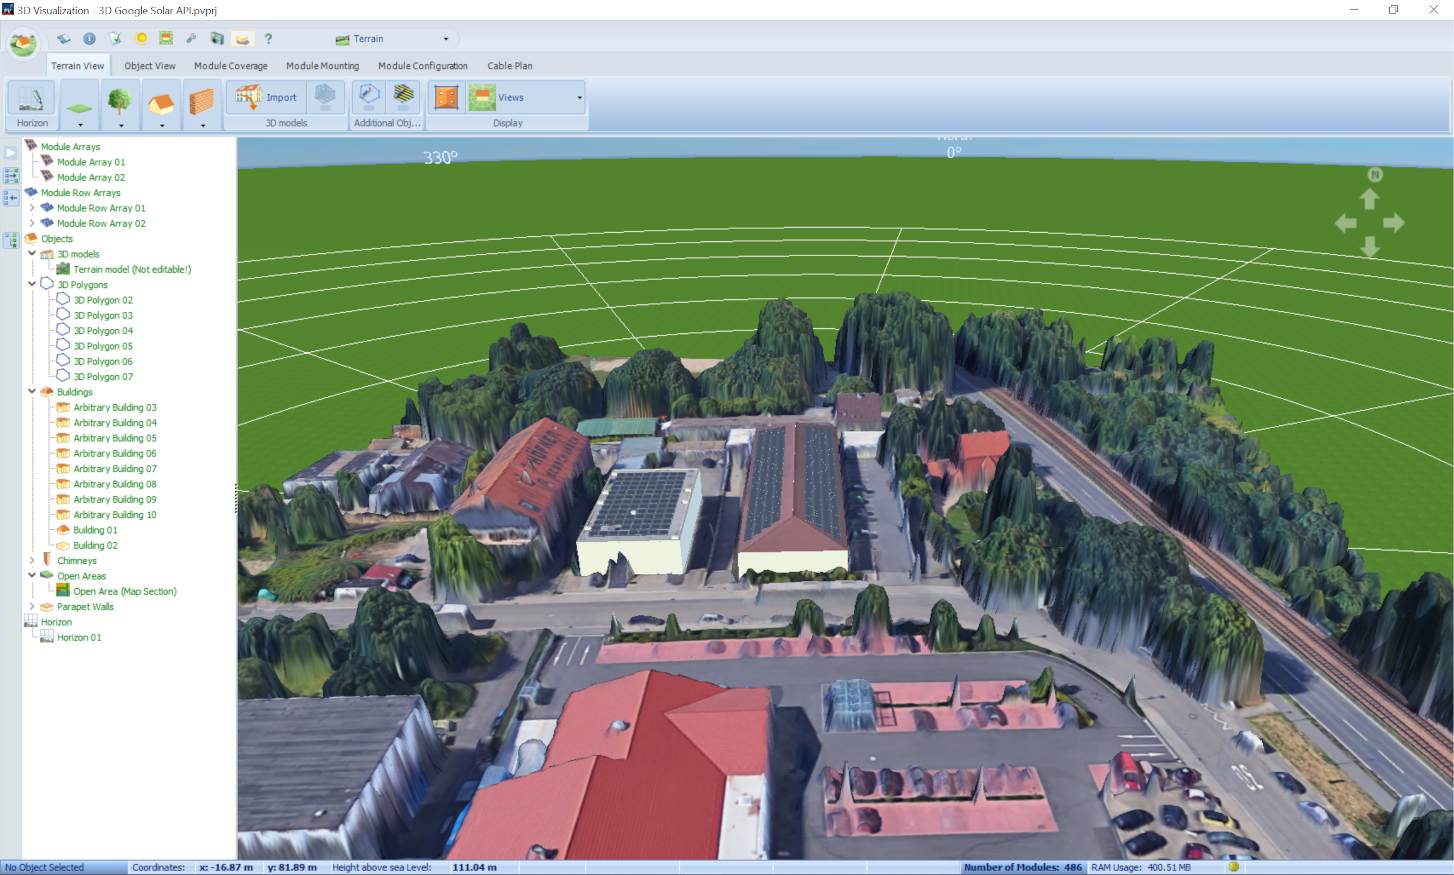
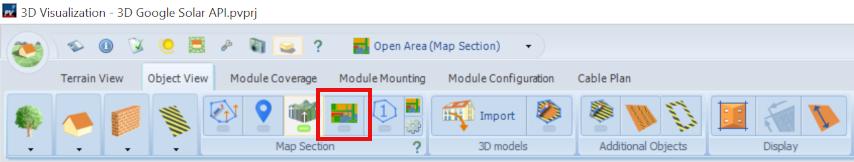
Terrain model
Click on 'Terrain model' to calculate and display the 3D terrain model
- The terrain model can be created with the terrain model button (an on/off button). The process may take a few seconds (LED on). - The same button can be used to remove the model from the project again (LED off).- In contrast to conventional imported 3D models, the model is purely passive in nature. It is not saved with the project, but is generated again and again from the height data
- It cannot be assigned and is only used to
- to check the extruded 3D objects (are the heights correct?)
- Presentation purposes (how does my system fit into the environment)
- and the shading calculation (shading frequency, shading simulation)
- The model can be modified in a variety of ways (see options)
- Size of the model
- Resolution of the model
- Recessing of drawn polygons and positioned 3D objects
- The model can be exported (see “Export terrain model”)
The terrain has an absolute height above sea level in the original data, but is shown normalized in the 3D visualization, i.e. the lowest point in the model is set to 0 and the other points are shown in difference to it.
Export terrain model
- Right-click on the “Terrain model” node in the tree view or right-click on the model in the editor (object view)
- A “Save as” dialog opens. An X-file can be stored in any directory on the hard disk
- Depending on the resolution and size of the model, the process can take between 30 seconds and 2-3 minutes
This 3D model (x file) can be imported as a conventional 3D model in a new PV*SOL project. Roof surfaces can then be covered directly without having to extrude them first
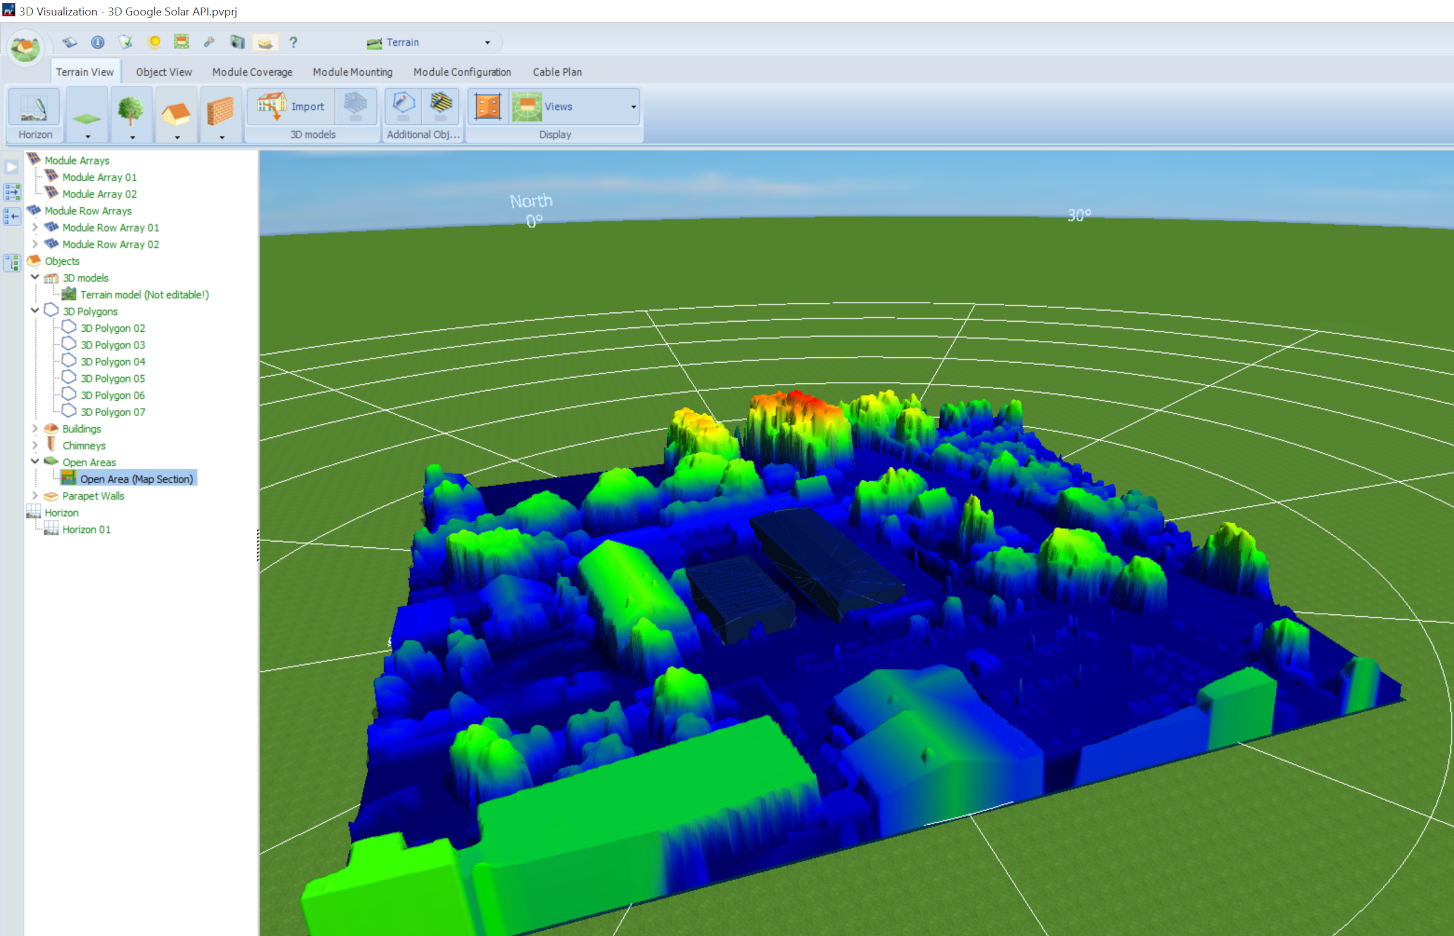
Height data overlay
Click on 'Elevation data overlay' to replace the textures of the map section and terrain model with the color-coded elevation values.
- The elevation data overlay button (an on/off button) can be used to switch the color-coded elevation data overlay on or off
- When the button is activated, the texture of the map free area and the terrain model changes to the elevation data overlay
- A color value is assigned to each height value that a pixel of the map has in reality.- The spectrum ranges from low altitudes that are displayed in cold colors (black, dark blue, blue) to high altitudes that are displayed in “hot” colors (orange, red)
- However, when returning to the PV*SOL® main program, the display is always reset to the map texture
Caption.
Height data dialog
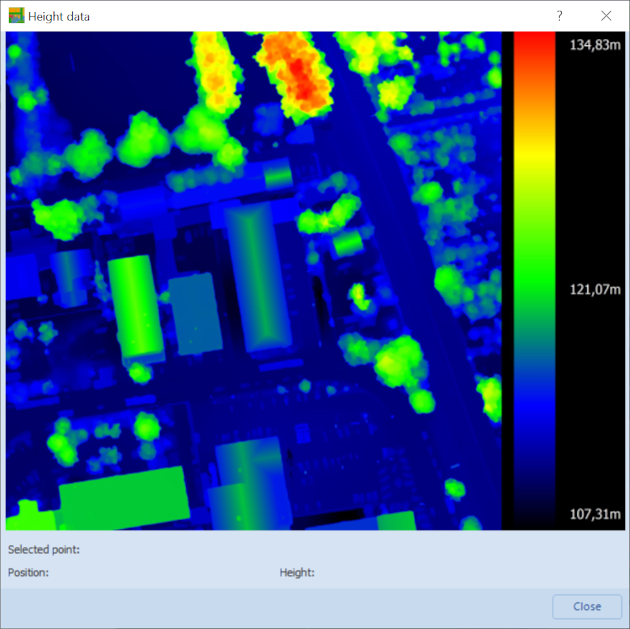
In the elevation values dialog, the elevation data is displayed graphically again as in the preview at the beginning.
- If you only want to obtain brief information about the altitude data, you can display the altitude values dialog.
- Similar to the map section in the 3D world, the exact height of a position can be read off with the mouse pointer.- If you are on a roof or similar in the building view, this is the only way to view the heights graphically.
Options
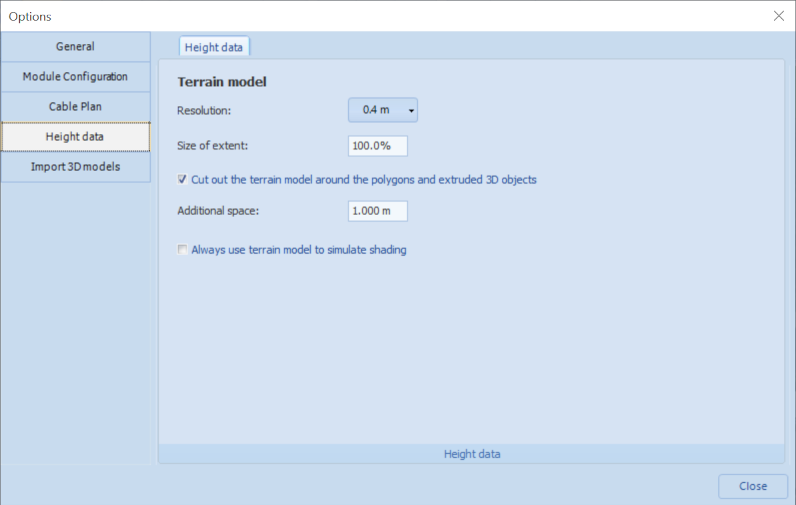
You can set the parameters for generating the terrain model in the options.
Resolution
- Resolution here refers to the raster width of the terrain model. With a resolution of 0.4m, the model is composed of 0.4m x 0.4m squares (quads)
- The steps 0.2m, 0.4m and 0.6m can be selected in the drop-down menu
Size of the section
- A map section with elevation values from the Google Solar API always has a dimension of 200 x 200 m
- You can use the size of the terrain model “section” to specify the percentage of the map section to be displayed as a terrain model
Cut out the terrain model around the polygons and extruded 3D objects:
- The preferred approach when using the elevation data is to trace and extrude the building footprints on the map section
- To ensure that the extruded buildings and other 3D objects can still be seen when the terrain model is active (i.e. they are not covered), their ground plan can be omitted within the generated terrain model! This can be activated with this checkbox
Additional distance:
- If the checkbox “Omit terrain .. model’ checkbox is activated, this parameter can be used to define an additional distance around the ground plan of the extruded objects and 3D polygons
- This increases the area around the ground plan that is omitted during terrain generation
Always perform shading simulation with terrain model:
- If this option is selected, the shading simulation is always performed with the terrain model when leaving the 3D environment, even if it was not activated at the time of leaving the 3D environment
If the options are changed, the model is regenerated as soon as the dialogue is closed.
See also