Energy balance
This overview lists the energy balance of the PV systems. Starting from the global radiation arriving on the module surface, the yield losses are gradually deducted.
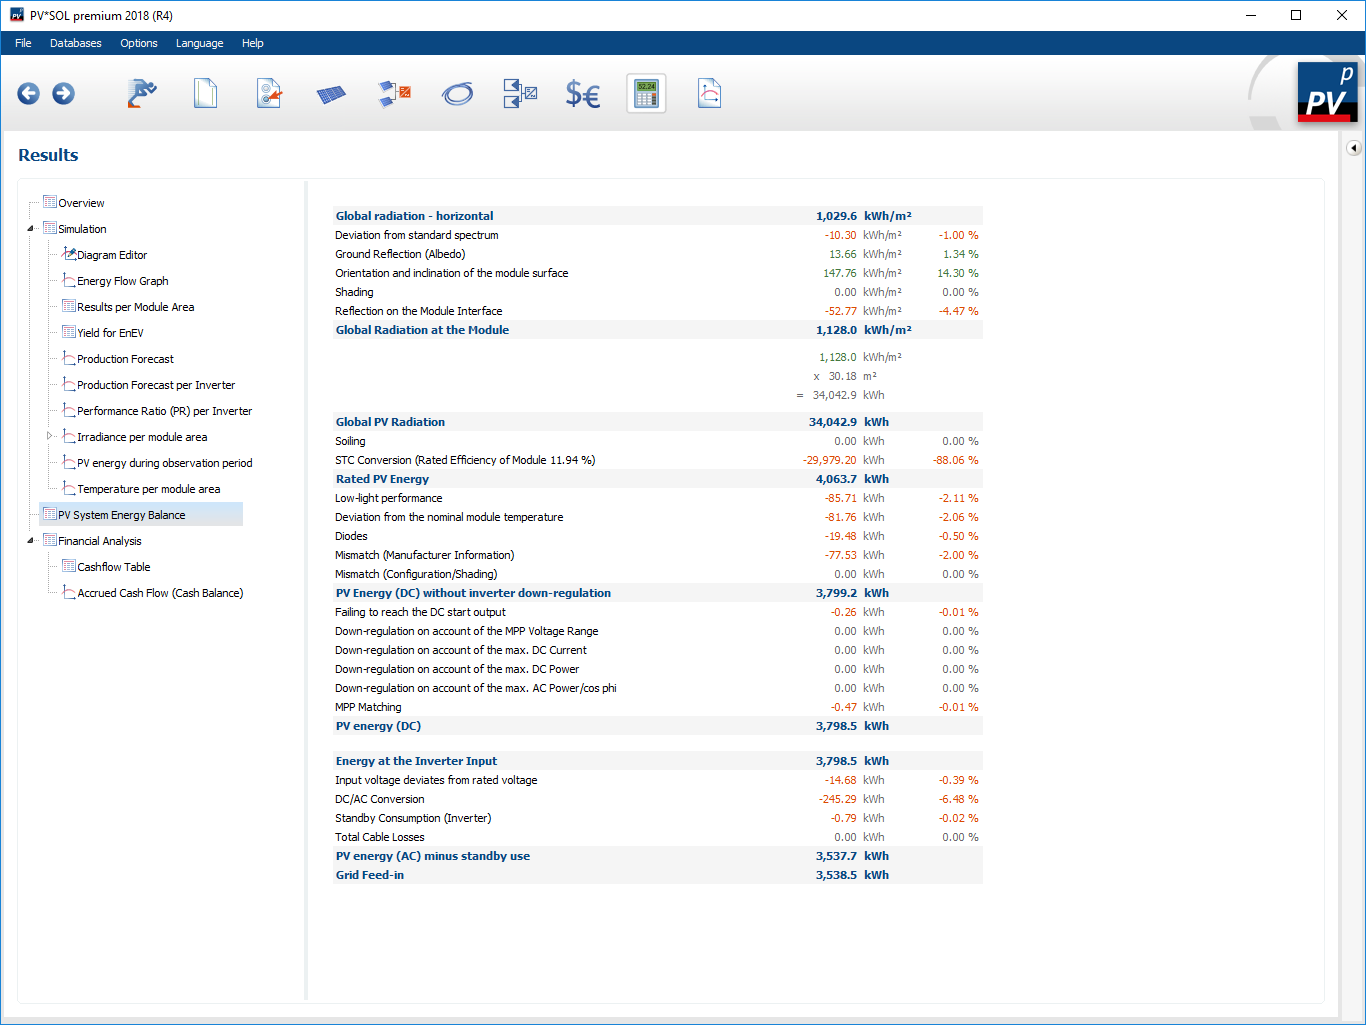
After the simulation of a PV system, the energy balances are displayed in the tree view on the Results page.
Select either the main level or one of the subsystems to see the respective energy balance:
- Energy balance: Energy balance of the entire plant
- Irradiation: The radiation system,
- Connection: the system that maps the PV generator and MPP tracker and
- Inverter: Inverter with AC side to mains connection. Depending on the design of the PV system, subsystems can occur several times, but at least once.
If there is more than one Meteo-System (for example by differently aligned module areas), the individual balances are calculated over the corresponding area of the PV sub-generator in relation to the total area of the system.
For several partial generator and WR systems, the individual balance sheets are summed up.
Topologies
The structure of the energy balances in the tree view depends on the topology of the PV system.
A 1-1-1 topology is composed as follows:
- 1 Meteo system: All modules are equally aligned and the same radiation balance applies to all.
- 1 Partial generator system: The modules are of the same design and all connected together to an MPP tracker.
- 1 Inverter system: Only one inverter is used.
Accordingly, the system would have a 1-2-1 topology if the modules were connected to two MPP trackers, but these belong to the same inverter.
A system with two differently aligned module surfaces, each connected to its own inverter, corresponds to a 2-2-2 topology.
Structure of the balancing zones
Each balance zone has a start value and an end value, which are highlighted in gray and in bold. The sub-generator balance zone has two further intermediate values which serve as orientation.
Loss (red letters) or winning sizes (green letters) are listed between start and end value. The last column shows the percentage value of the variance, always in relation to the total of the preceding values in the balance sheet.
Losses and gains
Meteo
-
Global radiation horizontal
The total global radiation on the horizontal plane, an input variable from the climate data -
Deviation from the standard spectrum
For photovoltaics, the STC standard spectrum at AM1.5 is always used as a basis. As the actual spectrum of solar radiation can be less favourable for the PV modules, one percent of the radiant power is deducted here. -
Ground reflection (albedo) \ The reflection of solar radiation on the ground leads to gains in the energy balance, which can vary depending on the set albedo value and the orientation and inclination of the modules.
-
Orientation and inclination of the module surface
Depending on how the modules are orientated in the room, the global radiation on this inclined plane may be higher or lower than on the horizontal plane. -
Shading
The proportion of radiation that does not reach the PV modules due to previous shading. -
Module-independent shading (only in 3D)
The proportion of solar radiation that is lost equally for all modules due to shading. This can be the case, for example, with a set horizon shading or with identically placed nearby shading objects. -
Reflection on the module surface
Some of the radiation that reaches the PV modules is reflected at the module surface before it can contribute to electricity production -
Global radiation at the module
The proportion of solar radiation that actually reaches the cell material of the PV modules
Conversion from meteo to partial generator
The global radiation on the modules in kWh/m² multiplied by the total area of the PV array results in the PV global radiation in kWh.
Partial generator
-
Global PV Radiation
The global radiation on the PV modules converted to kWh -
Soiling
Due to soiling on the module surface, not all radiation actually reaches the photovoltaically active layer of the PV module. The value of the soiling can be entered in the options. -
STC conversion
The proportion lost through photovoltaic energy conversion at STC. Corresponds to 100% - eta_STC -
Rated PV Energy
The energy that the module would emit under STC conditions -
Module-specific partial shading (only in 3D)
All losses caused by the individual shading of the PV modules are summarised here. The electrical losses are considered, which, depending on the shading situation and module structure, can sometimes be considerably higher than the pure solar radiation losses. -
Low-light performance
The efficiency of a PV module changes with varying irradiation. This can result in energy losses or gains. -
Deviation from the nominal module temperature
The efficiency of a PV module also depends on its temperature. As a rule, the higher the module temperature, the higher the resulting losses. Gains can also occur in cold regions. -
Diodes
As with any electronic component, losses occur at the diodes in the junction boxes of the modules, which are assumed to be 0.5%. -
Mismatch (Manufacturer Information)
Since PV modules in a batch generally do not have exactly the same nominal power, a mismatch occurs in the connection, which is estimated here at 2%. -
Mismatch (Configuration/Shading) \ Further mismatching can be caused by asymmetrical interconnection, interconnection of differently aligned module levels or uneven shading of the modules.
-
**String Cable (Optional: When entering detailed cable losses) **
The ohmic losses in the string cables -
DC main cable (Optional: When entering detailed cable losses)
The ohmic losses in the DC main cable -
PV Energy (DC) without inverter clipping
The DC-side PV energy that could be utilised with ideally designed MPP trackers and inverters -
DC storage charging (optional: for DC generator-coupled battery systems)**
The energy that is charged in the DC generator-coupled battery storage system, if present. -
Discharging the DC storage system (optional: for DC generator-coupled battery systems)**
The energy that is discharged from the DC generator-coupled battery storage system, if present, in order to cover loads. -
Failing to reach the DC start output**
Inverters have a minimum starting power from which they only start to feed in. If this is not reached, the inverter cannot feed in and the theoretically available energy is lost. -
Clipping on account of the MPP Voltage Range
MPP trackers have an input voltage range within which they can search for the MPP. If the true MPP of the PV field is outside this range, a non-optimal MPP is found, resulting in a loss. As a rule, however, the resulting current in the PV array is lower as a result, which is offset here. -
Clipping on account of the max. DC Current
Similar to the curtailment due to the MPP voltage range, curtailment may occur above the maximum permissible DC current. The lower ohmic losses are also taken into account here. -
Clipping on account of the max. DC Power
Analogue to derating due to the maximum DC current -
Clipping on account of max. AC power/cos φ
If the maximum permissible AC power of the inverter is exceeded or limited by the feed-in regulation, the system must also be regulated here.
The same applies if the maximum active power that can be fed into the grid is reduced by specifying a certain cos φ In systems with loads or batteries, the feed-in regulation only becomes effective at the grid connection point and therefore does not appear in the energy balance. -
PV energy (DC)
The PV energy generated on the DC side
Inverter
-
Energy at the Inverter Input
The energy available at the inverter input. Identical to PV energy (DC) -
Charge DC storage (optional: for DC intermediate-coupled battery systems)
The energy that is charged into the DC intermediate-coupled battery storage system, if present. -
Discharge DC storage (optional: for DC intermediate-coupled battery systems)
The energy that is discharged from the DC intermediate-coupled battery storage system, if present, in order to cover loads. -
Input voltage deviates from rated voltage
If the DC-side input voltage deviates from the nominal voltage of the inverter, the conversion efficiency is slightly reduced. -
DC/AC Conversion
The energy lost by converting DC voltage to AC voltage. -
Standby Consumption (Inverter)
The energy that the inverter draws from the grid when it is not feeding into the grid. -
Total Cable Losses (optional: when entering total cable losses) \
If you enter the cable losses on the Cable page as a percentage total loss, this value appears here. -
AC cable (optional: when entering detailed cable losses)
The ohmic losses of the AC cable. -
PV energy (AC) minus standby consumption
The directly usable or feed-in PV energy on the AC side. -
PV generator energy (AC grid)
The available energy of the PV generator on the AC grid side, i.e. taking standby consumption into account