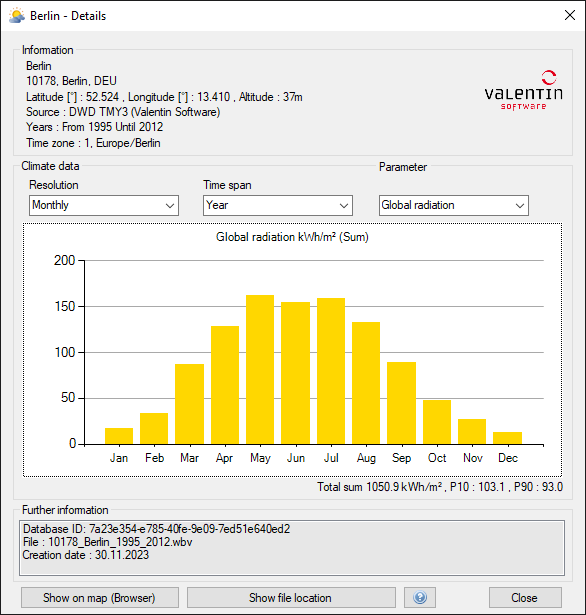
MeteoSyn WBV Detail View
The
![]() MeteoSyn detail view shows detailed information about a location.
It is split into three parts:
MeteoSyn detail view shows detailed information about a location.
It is split into three parts:
Information
- Name of the location
- Postcode, State and Country
- Latitude and Longitude values
- Altitude
- Source of the climate data (with logo of the source on the right side of this panel if available)
- Range of years
- Timezone
Climate data
- Resolution: Choose between a monthly or hourly resolution of the data displayed. If you choose monthly the data will be shown as monthly sums or monthly averages depending on the parameter.
- Time span: Choose if you want to see the data of the whole year or monthly values. If the resolution is set to monthly the timespan is always set as year.
- Parameters: Depending on the WBV-data you can choose which parameter should be displayed.Global radiation and temperature should be always available.
- Chart: In the center of this panel you will see the chart resulting of your setup.
- Additional information: Below the chart you can see the total sum or average of the values, depending on the parameter. If GHI i selected you can also see P10/P90 values. These are mainly used for bankability assertions. P90 is a value which is expected to be exceeded in 90% of the cases, which is often used for conservative plannings. P10 is a higher value and is there expected to be exceeded in 10% of the cases. If those values are missing it does not affect the PV-simulation, but can affect the economy-calculation in some cases.
Further information
- DB User ID
- File path
- Creation date
- Anomalies: If the climate-data shows anomalies, e.g. missing GHI data for longer than 24 hours, it will be displayed here.
Below the three panels you have the option to jump to the current folder of the file and to show the climate data location on a map in your preferred browser. You can also see the climate data location on a map in MeteoSyn when you select the location and choose “Map” in the main window.
